Published Date : 2019年12月14日6:30
p5.jsを使ってCSVファイルからグラフを作成する ~ 其の1 ~
Create a graph from a CSV file using p5.js – Part 1
This blog has an English translation
今回はp5.jsを使って、CSVファイルからデータを読み取り、それをグラフ化する事を試してみました。
This time I tried using p5.js to read data from a CSV file and graph it.
久しぶりにp5.jsを使ってみたくなり、復習も兼ねているので、基礎的な内容になります。
I want to use p5.js for the first time in a while, and it also serves as a review, so it's a basic content.
以下に、今回作った日経平均のデータを使ったグラフを示します。
The following is a graph using the Nikkei Stock Average data created this time.
Nikkei 225
ロードに時間がかかりますが、p5.jsはお絵かきソフトに数値を入力するようにプログラミングできるので、やりたいことがすぐ具現化できるところが最大のメリットです。
It takes time to load, but the biggest advantage of p5.js is that you can do what you want right away because you can program like entering numbers into drawing software.
ちなみに記事は長いので、前半と後半に分けます。
Note: the blog post has become too long, so I divided it into the first half and the second half.
目次
Table of Contents
全体のコード The entire p5.js code |
HTMLファイルの説明 Description of HTML file |
p5.jsファイルの説明(途中まで) Description of p5.js file (halfway) |
ページの最後へ Go to the end of the page. |
全体のコード
The entire p5.js code
まず最初に、グラフの描画とCSVを読み込むのに必要なP5.jsとHTMLのコード全体を示します。
First, I'll show you the full P5.js and HTML code required to draw the graph and load the CSV file.
ファイルの構造は以下になります。
The file structure is as follows.
appropriate floder
  - index.html
  - sketch.js
  - drawGraph.js
  - N255.csv
まず適当なフォルダを作り、その中にHTMLファイルと2つのJSファイルを作ります。
First, you create a folder, and then create an HTML file and two JS files in it.
それから、1984年末からの日経平均株価のデータが入ったCSVファイルをヤフーファイナンシャルのサイトからダウンロードしてフォルダに入れます。
Then, download the CSV file containing the data of Nikkei stock average since the end of 1984 from this Yahoo Finance website and put it in the folder.
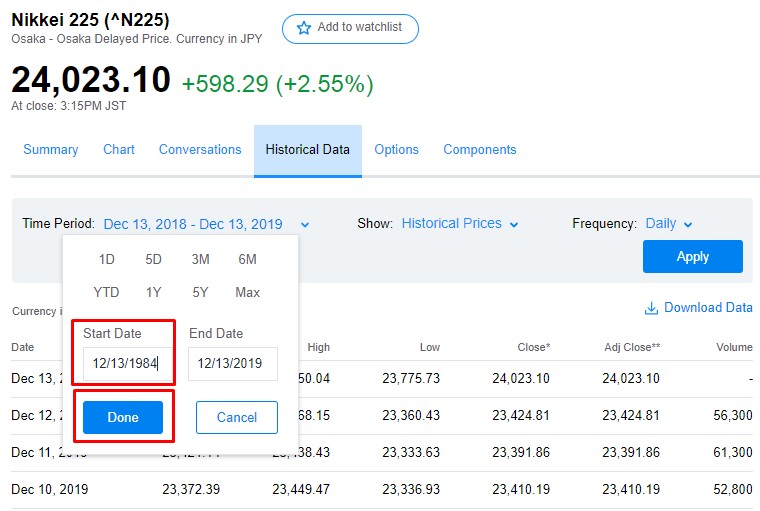
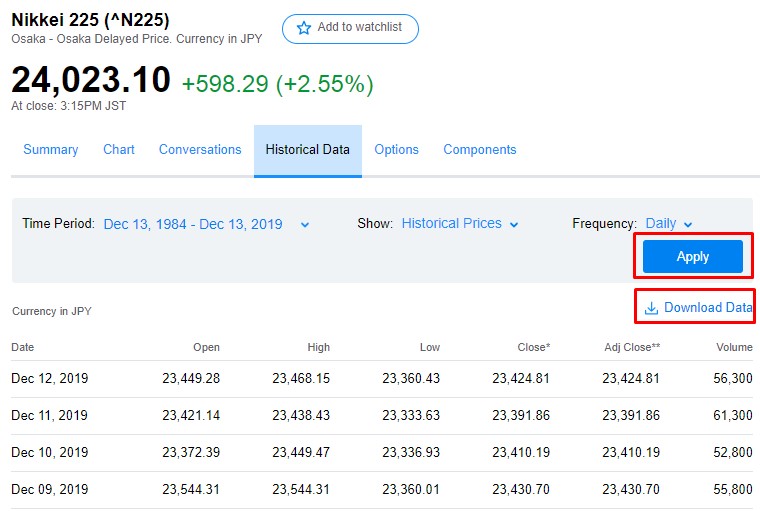
期間を指定して、アプライを押したあと、ダウンロードします。
Specify a time period, press [apply], and press [download].
それから中身を書いてきます。
Then, you'll write down the code.
sketch.js
let table;
let cwidth = 840;
let cheight = 450;
let offsetWidth = 720;
let offsetHeight = 330;
let totalRow;
let params = [];

let period;
let gstyle;

let date;
let open;
let high;
let low;
let close;
let adjClose;
let volume;

// Default Draw;
let defaultDraw;

// all preriods, eighties, nineties, noughties, twenty-tens
let allPeriods;
let eighties;
let nineties;
let noughties;
let twentyTens;

function preload() {
  table = loadTable('N225.csv', 'csv', 'header');
}

function setup() {

  createCanvas(cwidth, cheight);

  totalRow = table.getRowCount();

  background(255);

  date = table.getColumn('Date');
  open = table.getColumn('Open');
  high = table.getColumn('High');
  low = table.getColumn('Low');
  close = table.getColumn('Close');
  adjClose = table.getColumn('Adj Close');
  volume = table.getColumn('Volume');

  textAlign(CENTER);

  push();
  strokeWeight(1);
  text('Graph style', 45, 20);
  pop();

  gstyle = createSelect();
  gstyle.position(85, 5);
  gstyle.option('normal');
  gstyle.option('bar');
  gstyle.changed(toggleDuration);

  push();
  strokeWeight(1);
  text('Date range', 190, 20);
  pop();

  period = createSelect();
  period.position(230, 5);
  period.option('from 1985 to 2019');
  period.option('1980\'s');
  period.option('1990\'s');
  period.option('2000\'s');
  period.option('2010\'s');
  period.changed(toggleDuration);

  // Default Draw
  defaultDraw = new DrawGraph('normal', 1, 1984, 2019, true);
  defaultDraw.display();
}

function toggleDuration() {
  background(255);
  push();
  text('Graph style', 45, 20);
  text('Date range', 190, 20);
  pop();
  let item = period.value();

  switch (item) {
    case 'from 1985 to 2019':
      allPeriods = new DrawGraph(gstyle.value(), 1, 1984, 2019, true);
      allPeriods.display();
      break;
    case '1980\'s':
      eighties = new DrawGraph(gstyle.value(), 6, 1984, 1989, false);
      eighties.display();
      break;
    case '1990\'s':
      nineties = new DrawGraph(gstyle.value(), 3, 1990, 1999, false);
      nineties.display();
      break;
    case '2000\'s':
      noughties = new DrawGraph(gstyle.value(), 3, 2000, 2009, false);
      noughties.display();
      break;
    case '2010\'s':
      twentyTens = new DrawGraph(gstyle.value(), 3, 2010, 2019, false);
      twentyTens.display();
      break;
  }
}
drawGraph.js
class DrawGraph{
  constructor(graphStyle, scale, start, end, all){
      this.offset = (cwidth - offsetWidth) / 2;
      this.numArray = [];
      this.graphStyle = graphStyle;
      this.scale = scale;
      this.start = start;
      this.end = end;
      this.all = all;
      this.params = [];
  }

  display(){

      for (let i = 0; i < totalRow; i++) {
          if (table.getColumn('Date')[i] != 'null'){
              let spritString = split(table.getColumn('Date')[i], '-');
              let check = int(spritString[0]);

              if (check >= this.start && check <= this.end){
                  if(high[i] != 'null'){
                      this.numArray.push(int(high[i]));
                  }

                  this.offset += (offsetWidth / totalRow) * this.scale;

                  // change style
                  if (this.graphStyle == 'bar'){
                      push();
                      strokeWeight(0.1);
                      stroke(0,0,255);
                      noFill();
                      rect(this.offset, cheight - (close[i] * 0.01), 0.05, (close[i] * 0.01) - ((cheight - offsetHeight) / 4));
                      pop();
                  } else {
                      push();
                      strokeWeight(0.1);
                      stroke(0,0,255);
                      point(this.offset, cheight - (low[i] * 0.01), this.offset, cheight - (high[i] * 0.01));
                      pop();
                  }


                  if ((spritString[1] == '01' && spritString[2] == '01') || (spritString[1] == '01' && spritString[2] == '02') || (spritString[1] == '01' && spritString[2] == '03') || (spritString[1] == '01' && spritString[2] == '04') || (spritString[1] == '01' && spritString[2] == '05') || (spritString[1] == '01' && spritString[2] == '06')){
                      let templist = [check, this.offset];
                      this.params.push(templist);
                  }

              }
          }
      }

      // duration.
      for(let i = this.start; i <= this.end; i++){
          for(let j = 0; j < this.params.length; j++){
              if (this.params[j][0] == i){
                  if (this.all){
                      if ((this.params[j][0] - 1984) % 5 == 0 ){
                          push();
                          stroke(0);
                          strokeWeight(0.1);
                          pop();
                          push();
                          line(this.params[j][1], cheight - ((cheight - offsetHeight) / 4), this.params[j][1], ((cheight - offsetHeight) / 4));
                          textStyle(ITALIC);
                          text(this.params[j][0], this.params[j][1], cheight - ((cheight - offsetHeight) / 12));
                          pop();
                          break;
                      }
                  } else {
                      push();
                      stroke(0);
                      strokeWeight(0.1);
                      line(this.params[j][1], cheight - ((cheight - offsetHeight) / 4), this.params[j][1], ((cheight - offsetHeight) / 4));
                      pop();
                      push();
                      textStyle(ITALIC);
                      text(this.params[j][0], this.params[j][1], cheight - ((cheight - offsetHeight) / 12));
                      pop();
                      break;
                  }
              }
          }
      }


      push();
      stroke(0);
      strokeWeight(1);
      // value
      line((cwidth - offsetWidth) / 4, (cheight - offsetHeight) / 4, (cwidth - offsetWidth) / 4, cheight - ((cheight - offsetHeight) / 4));
      // date
      line((cwidth - offsetWidth) / 4, cheight - ((cheight - offsetHeight) / 4), cwidth - ((cwidth - offsetWidth) / 4), cheight - ((cheight - offsetHeight) / 4));
      pop();

      // max
      let maxVal = max(this.numArray);
      push();
      stroke(255,0,0);
      strokeWeight(0.1);
      line((cwidth - offsetWidth) / 4, cheight - (maxVal * 0.01), cwidth - ((cwidth - offsetWidth) / 4), cheight - (maxVal * 0.01));
      textSize(9);
      strokeWeight(1);
      fill(255,0,0);
      text(maxVal, (cwidth - offsetWidth) / 8, cheight - (maxVal * 0.01));
      pop();

      for(let i = 0; i <= 12*3000; i+=3000){
          push();
          stroke(0);
          strokeWeight(0.1);
          line((cwidth - offsetWidth) / 4, cheight - (i * 0.01), cwidth - ((cwidth - offsetWidth) / 4), cheight - (i * 0.01));
          pop();
          push();
          textSize(9);
          strokeWeight(1);
          fill(0);
          text(i, (cwidth - offsetWidth) / 8, cheight - i * 0.01);
          pop();
      }

      // min
      let minVal = min(this.numArray);
      push();
      stroke(255,0,0);
      strokeWeight(1);
      line((cwidth - offsetWidth) / 4, cheight - (minVal * 0.01), cwidth - ((cwidth - offsetWidth) / 4), cheight - (minVal * 0.01));
      textSize(9);
      strokeWeight(1);
      fill(255,0,0);
      text(minVal, (cwidth - offsetWidth) / 8, cheight - (minVal * 0.01));
      pop();
      }
}
index.html
<!DOCTYPE html>
<html lang="en">
<head>
    <meta charset="UTF-8">
    <meta name="viewport" content="width=device-width, initial-scale=1.0">
    <meta http-equiv="X-UA-Compatible" content="ie=edge">
    <script src="https://cdnjs.cloudflare.com/ajax/libs/p5.js/0.6.1/p5.min.js"></script>
    <script src="https://cdnjs.cloudflare.com/ajax/libs/p5.js/0.6.1/addons/p5.dom.min.js"></script>
    <script src="sketch.js"></script>
    <script src="drawGraph.js"></script>
    <title>Document</title>
</head>
<body>
</body>
</html>
HTMLファイルの説明
Description of HTML file
それではHTMLファイルの中身の簡単な説明です。
Here is a brief description of the contents of the HTML file.
<script src="https://cdnjs.cloudflare.com/ajax/libs/p5.js/0.6.1/p5.min.js"></script>
<script src="https://cdnjs.cloudflare.com/ajax/libs/p5.js/0.6.1/addons/p5.dom.min.js"></script>
この部分ではp5.jsのライブラリをウェブから取得しています。
This part of the code gets the p5.js library from the web.
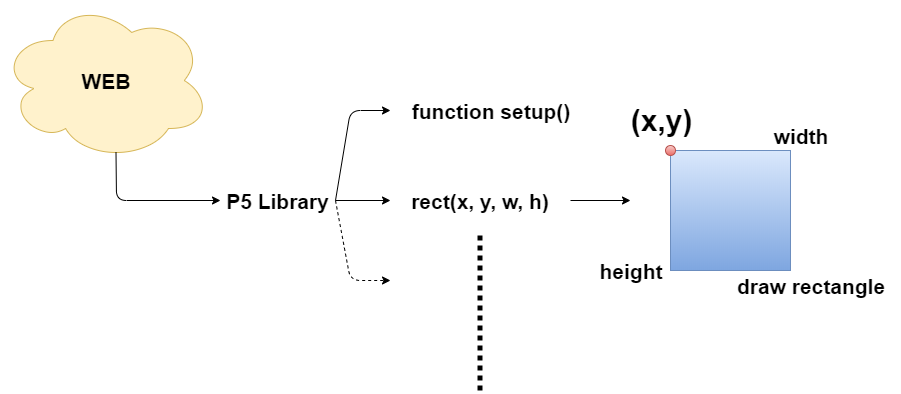
このようにライブラリを読み込めば、p5.jsが用意してくれている長方形を描く関数や、他の便利な関数等を使うことができます。
If you load the library like this, you can use p5.js's functions for drawing rectangles and other useful functions.
これをJavascriptだけで行うととても大変な作業になるので、それらを簡単で使い易い関数にして、全て纏めて提供してくれているのがライブラリです。
This can be a lot of work if done in Javascript alone, so the library provides everything together a set of functions that are simple and easy to use.
<script src="sketch.js"></script>
<script src="drawGraph.js"></script>
後は作ったJSファイルを読み込むだけです。
Then, All you have to do is load the JS file you created.
p5.jsはHTML内に勝手にCanvasを作ってくれて、そのCanvasに図形等が描写されます。
p5.js creates a canvas within the HTML itself, and the canvas draws graphics and other objects.
<body>

+ <canvas id="defaultCanvas0" class="p5Canvas" width="840" height="450" style="width: 840px; height: 450px;"></canvas>

</body>
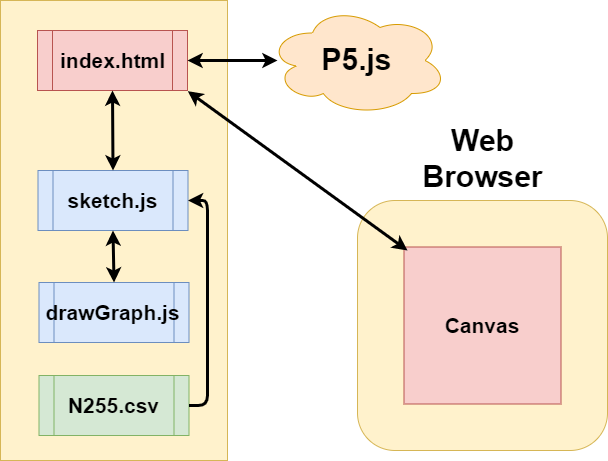
このように、index.htmlはWEBからP5のライブラリを読み込み、 JSファイルはP5のライブラリを使って、CSVファイルの読み込みます。 そして、HTML内部にCanvasを作り、図を作成します。
In this way, index.html reads the p5.js library from the WEB. JS files use the p5.js library to load csv files. Then create a canvas inside the HTML to create the diagram.
p5.jsファイルの説明(途中まで)
Description of p5.js file (halfway)
お次はJSファイルの中身の簡単な説明です。
Next, I'll show you brief description of the contents of the JS file.
let table;
let cwidth = 840;
let cheight = 450;
let offsetWidth = 720;
let offsetHeight = 330;
let totalRow;
let params = [];

let period;
let gstyle;

let date;
let open;
let high;
let low;
let close;
let adjClose;
let volume;

// Default Draw;
let defaultDraw;

// all preriods, eighties, nineties, noughties, twenty-tens
let allPeriods;
let eighties;
let nineties;
let noughties;
let twentyTens;
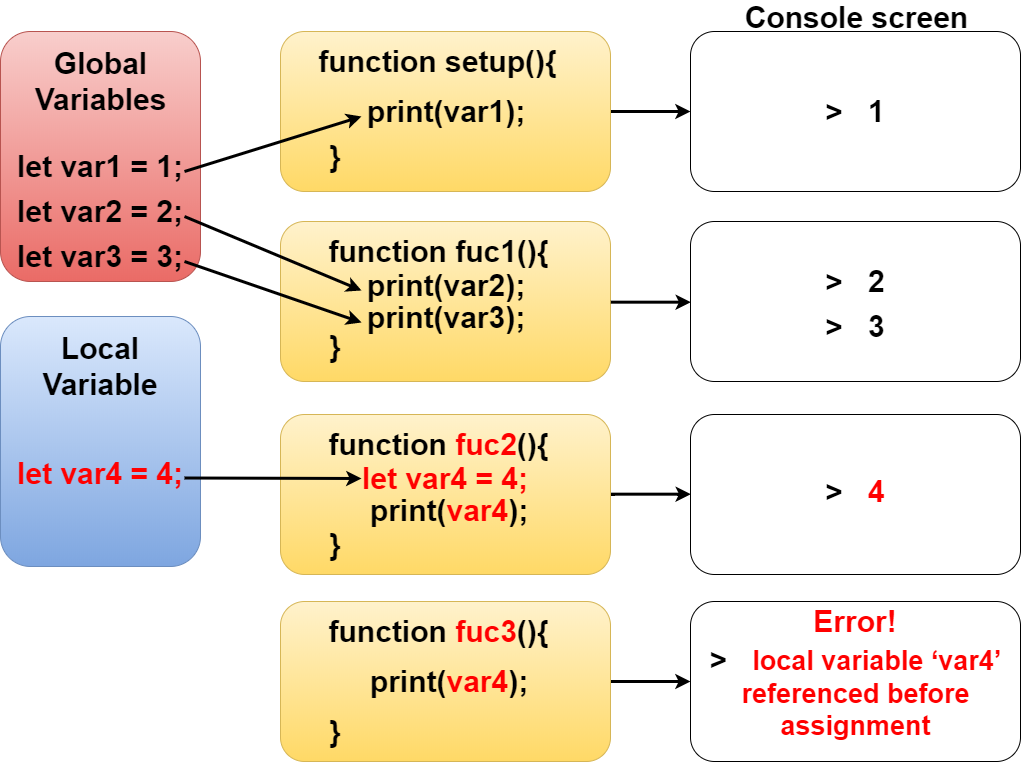
全ての場所から参照できるように、最初に変数を宣言しています。
I declare variables first so that they can be referenced from anywhere.
これらの変数の役割は画面の幅だったり、オフセットを使って図形の余白を設定したりするためだったり、 期間やCSVデータ、CSVデータの行と列、株価の値、セレクトエレメント、クラスファイルのインスタンスを格納する為のものです。
These variables can be used to determine the width of the screen or to set the margin of the shape using offsets. It stores periods, CSV data, rows and columns of CSV data, stock price values, select elements, and instances of class files.
グローバル変数はどこからでも参照できますが、関数内で宣言した変数はローカル変数となり、 別の関数で使うとエラーが起こります。
Global variables can be referenced anywhere, but variables declared within a function are local variables. If you use it in another function, an error occurs.
function preload() {
  table = loadTable('N225.csv', 'csv', 'header');
}

function setup(){

  ...............................................

}
こちらのpreload関数はsetup関数が呼ばれる前に発動します。 P5jsはsetup関数が一番最初に呼ばれるよう設定されています。 CSVファイルの読み込みに時間がかかる場合、preload関数無しだと、 最初にsetup関数が呼ばれてしまい、環境の準備が整う前にキャンバスに図形を描写しようとします。 すると当然エラーになるので、それを防ぐ為にpreload関数が用意されています。
This preload function is invoked before the setup function is called. p5.js is configured so that the setup function is called first. If the CSV file takes a long time to load, without the preload function, the setup function is called first and tries to draw the figure on the canvas before the environment is ready. The preload function is provided to prevent such errors.
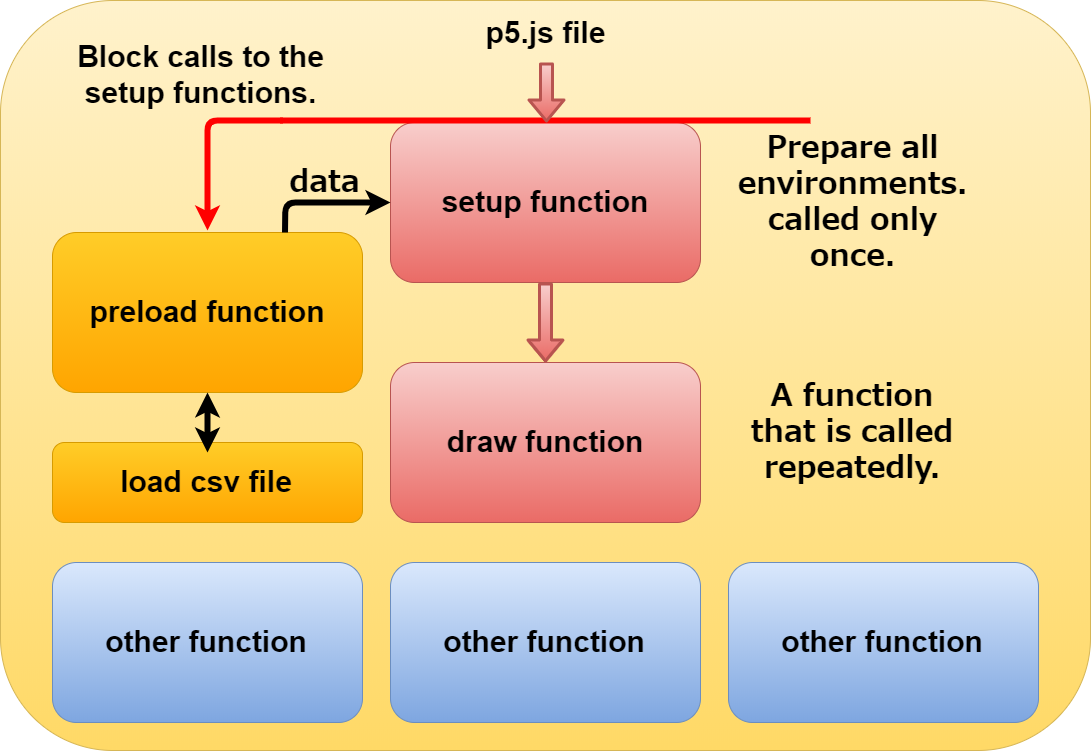
ただし、非同期の読み込みがしたい場合は、setup関数やその他の場所でコールバックを使用してCSVや画像、JSON等の読み込みメソッドを呼び出すこともできます。
However, if you want to do asynchronous loading, you can also use a callback in the setup function or elsewhere to call loading methods that loads CSV, image, or JSON file.
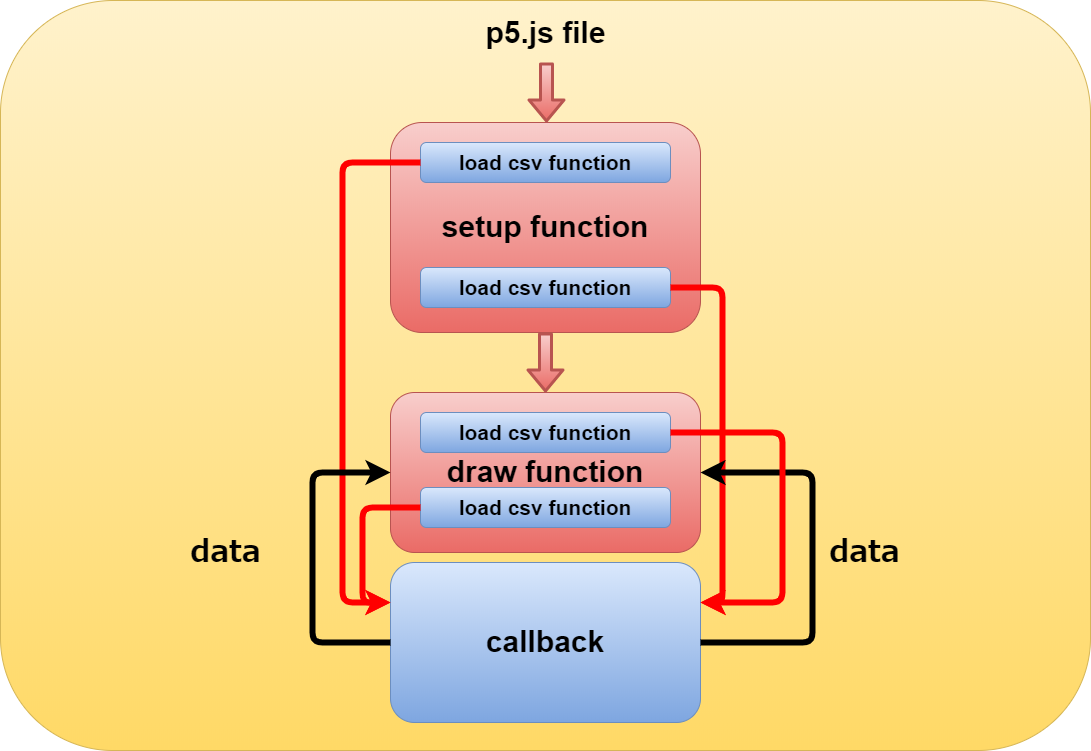
試しにテストでコールバックの動きを見てみます。
Let's try and see how the callback works.
let table;


function setup() {
    print('setup function');

    loadTable('N225.csv', 'csv', 'header', function(loadedTable) {
        table = loadedTable;
    });

    if (table != undefined) {
        totalRow = table.getRowCount();
        print(totalRow);
    }

    createCanvas(600, 600);
    print('setup function');
    frameRate(1);
    fill(0,0,255);
    rect(100,100,100,100);

    loadTable('N225.csv', 'csv', 'header', function(loadedTable) {
        table = loadedTable;
    });

    if (table != undefined) {
        totalRow = table.getRowCount();
        print(totalRow);
    }

    print('setup function');
}

function draw() {
    print('draw function');
    background(0);
    fill(0,0,255);
    rect(100,100,100,100);

    if (table != undefined) {
        totalRow = table.getRowCount();
        print(totalRow);
    }

    print('draw function');

    if (table != undefined) {
        totalRow = table.getRowCount();
        print(totalRow);
    }

    print('draw function');
}
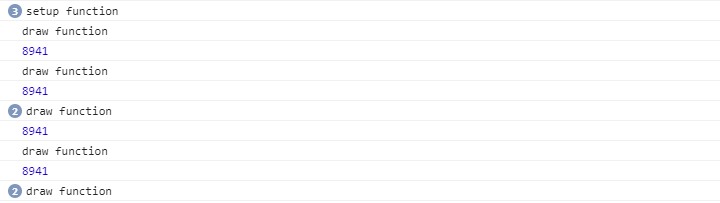
setup関数内で2回、draw関数内で2回コールバックしています。 setup関数の処理は一瞬なので、すぐdraw関数内に入ってループをしています。 draw関数内ではプリント関数が動いた後に結果が表示されていますが、 素通りしてプリント関数だけが動いているフレームがあります。 フレームレイトを1に設定すると、1秒間に1フレームになります。 わかりやすく言うと、フレームレイトが24なら、1秒間に24回draw関数の処理が行われます。
It calls back twice in the setup function and twice in the draw function. Because the setup function is instantaneous, it immediately enters the draw function and loops. Within the draw function, the results are displayed after the print function has executed. There are frames where only the print function is executing without callback. A frame rate of 1 results in one frame per second. In other words, if the frame rate is 24, the draw function is processed 24 times per second.
大体コールバックのイメージは掴めたでしょうか? では話が脱線してしまったので元に戻ります。
Did you understand about the callback? Now that I've told you a different stroy, let's return to the code description.
function setup() {

  createCanvas(cwidth, cheight);

  totalRow = table.getRowCount();

  background(255);
続いてセットアップ関数内の説明です。 このクリエイトキャンバス関数にウィンドウの横幅と縦のサイズを指定すると、 HTML内にキャンバス要素が作られ、図を描く準備が整います。
Following is the description in the setup function. When you specify the width and height of the window in this createCanvas method, a cavas element is created in the HTML and you are ready to draw the shape.
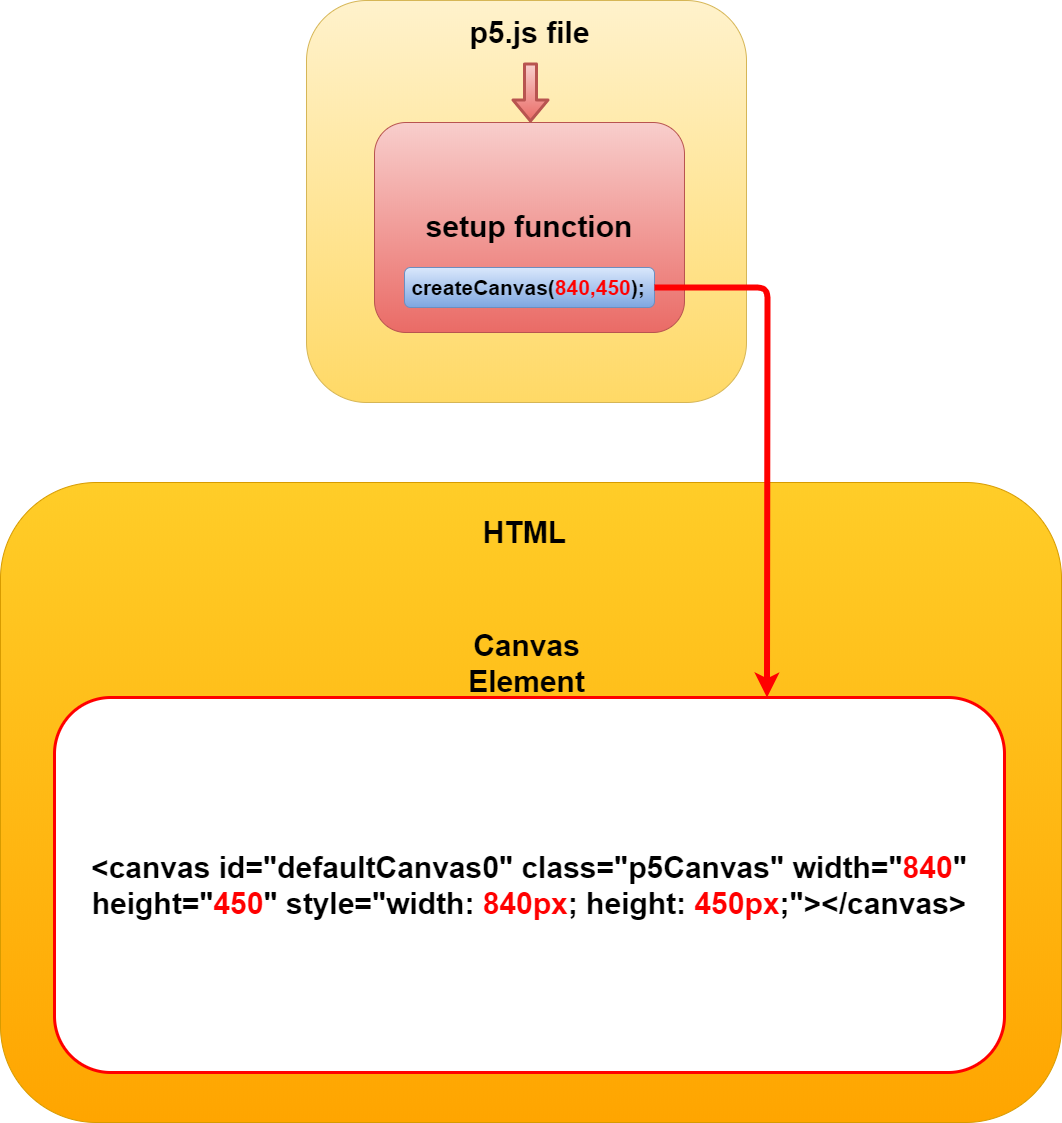
ID名"defaultCanvas0"とClass名"p5Canvas"は自動で付けられます。
The ID name "defaultCanvas0" and Class name "p5Canvas" are automatically assigned.
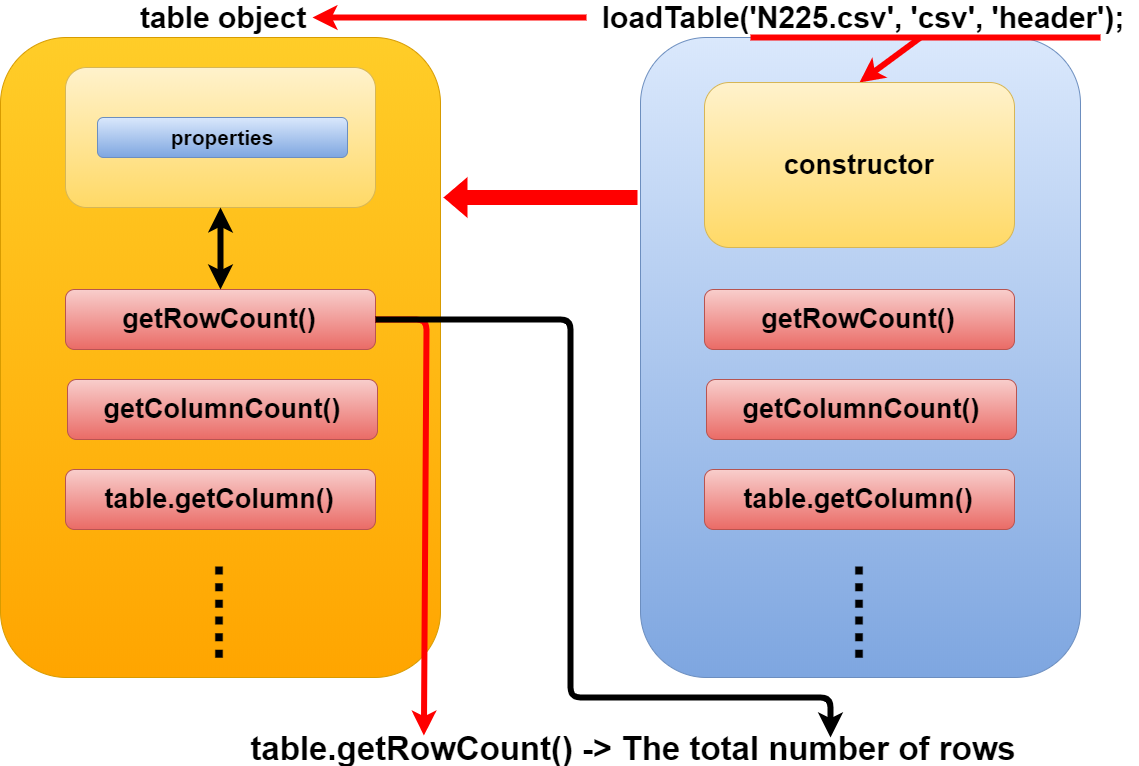
そして、変数tableはCSVのデータを操作するオブジェクトになっています。 オブジェクトが持っているメソッドgetRowCount()を使って、全ての行数を変数totalRowへ格納します。
The variable table is an object that manipulates the CSV data. The object has a getRowCount() method that counts the total number of rows. Use this method to store a number in the totalRow variable that we declared first.
backgroundメソッドはキャンバスの背景色を決めます。
The background method determines the background color of the canvas.

長くなってしまったので、次回へ続きます。
I will carry over the rest of the explanation next time.