Published Date : 2020年1月12日7:27
Processingを数学のノート代わりに使う - Part 2
Use Processing as a math notebook - Part 2
This blog has an English translation
前回の記事の続きです。
This is the continuation of the previous blog post.
全体の説明は動画に任せるとして、説明が必要だろうと思われる関数やアルゴリズム等を時系列順に紹介していきMASU。
I'll leave the entire explanation to the video, but I'll show you the functions, algorithms, and so on, in chronological order.
目次
Table of Contents
正弦波の式 - 4:20 ~ sine wave formula - 4:20 ~ |
float t ? - 5:30 ~ float t ? - 5:30 ~ |
プッシュ、ポップスタイルとアーク関数 - 10:00 ~ push-pop Style, and arc function - 10:00 ~ |
ページの最後へ Go to the end of the page. |
正弦波の式 - 4:20 ~
sine wave formula - 4:20 ~
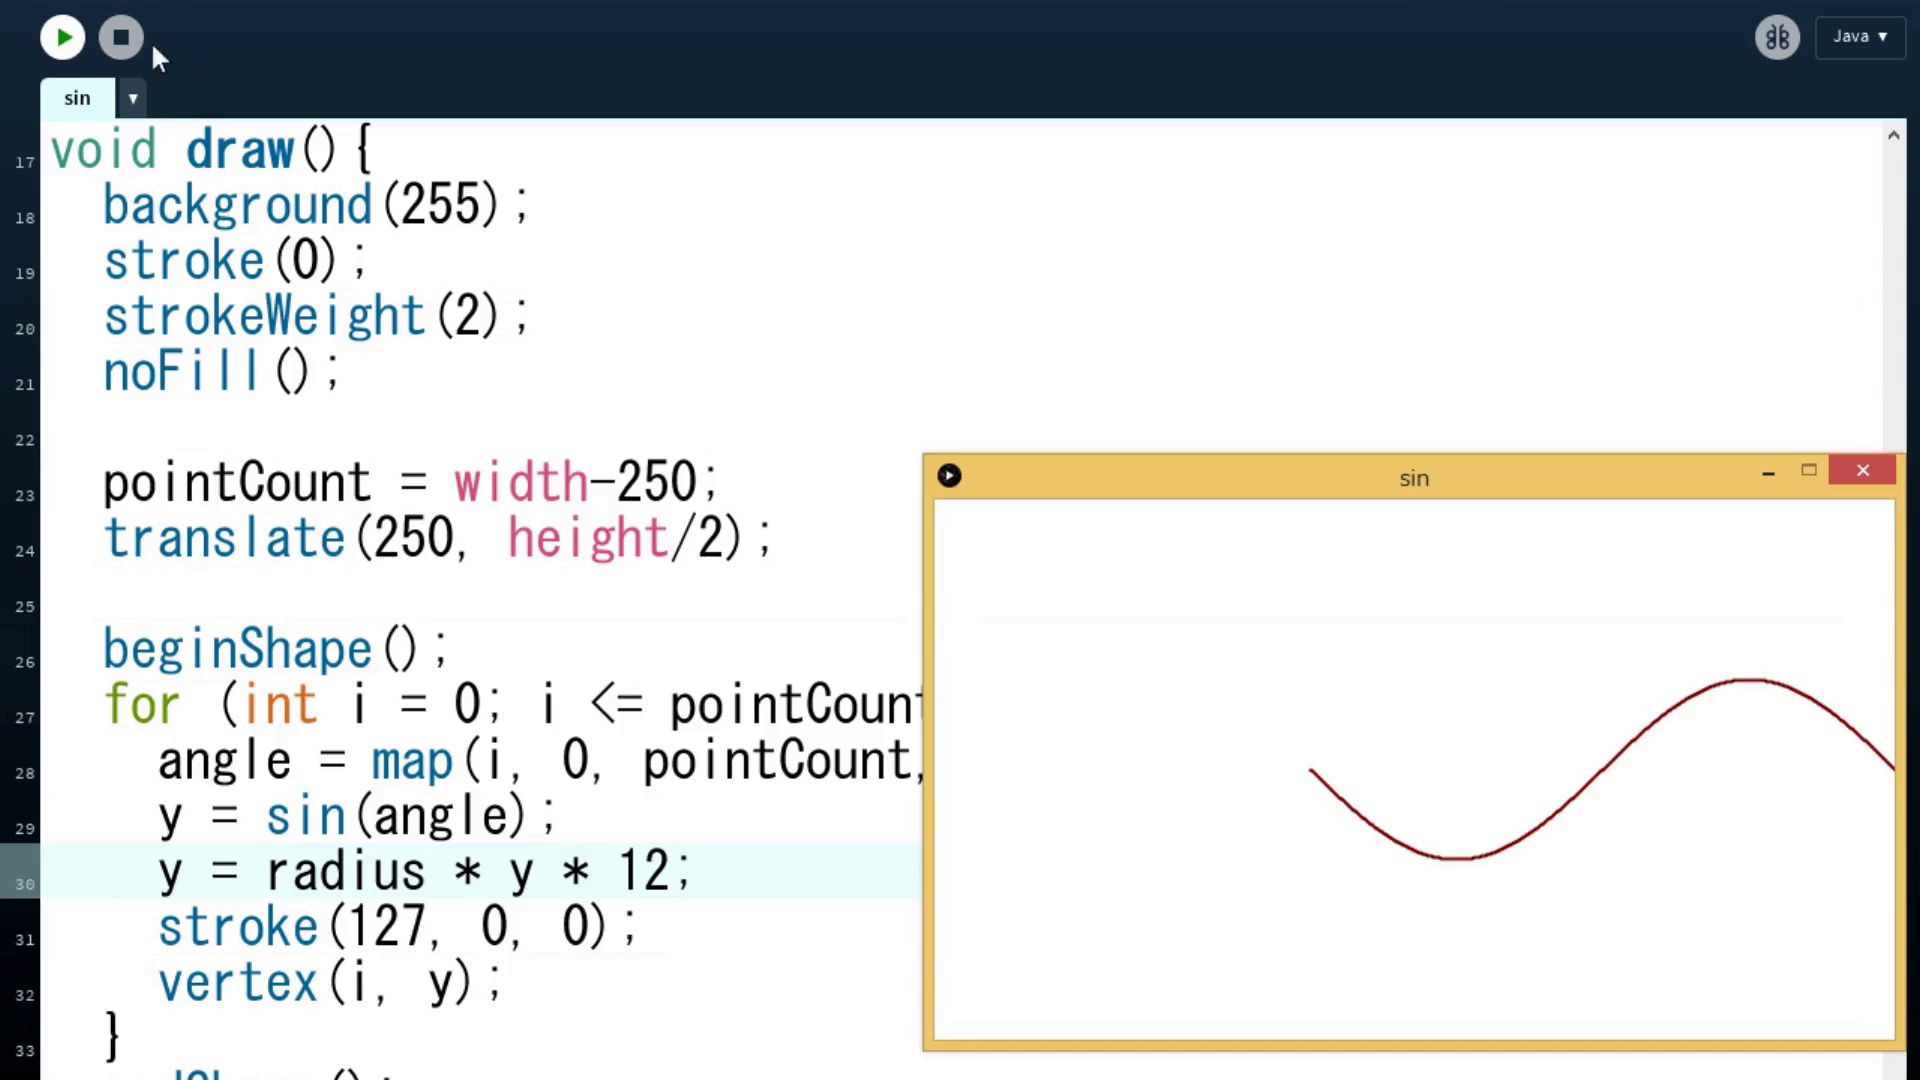
前回説明した通りyの位置はsin(angle -> (radians(degree)))で決まります。
As I explained previously, the position of y is determined by sin(angle -> (radians(degree))).
今回でてきたこの式も基本的には同じ考えです。
This formula presented this time is basically the same idea.
y = sin(angle*freq + radians(phi))
初期値のfreq(振動数)は1、radians(phi)(初期位相)は0なので、 単純にy = sin(angle)になります。
The default value of freq(frequency) is 1, and radians(phi)(initial phase) is 0, so simply y = sin(angle).
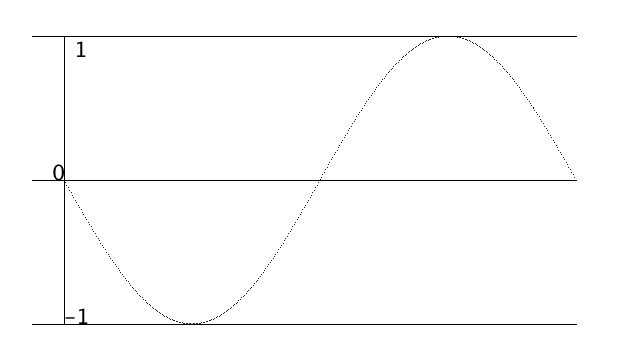
最初は一秒間に上下する数は図の通り、一回です。0からー1、そして1になり、0に戻り、これで一回とカウントします。
At first, the number of ups and downs per second is 1 as shown in the figure. It changes from 0 to -1, then 1, then back to 0, and so on, which is frequency 1.
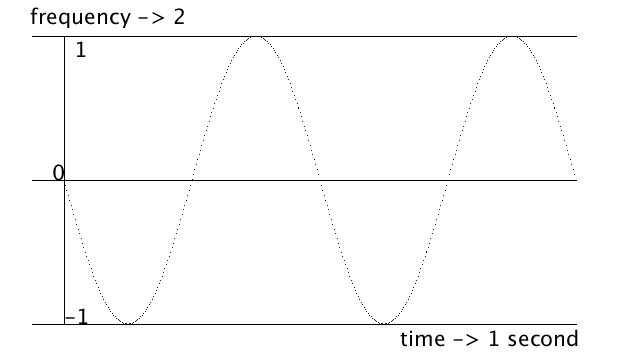
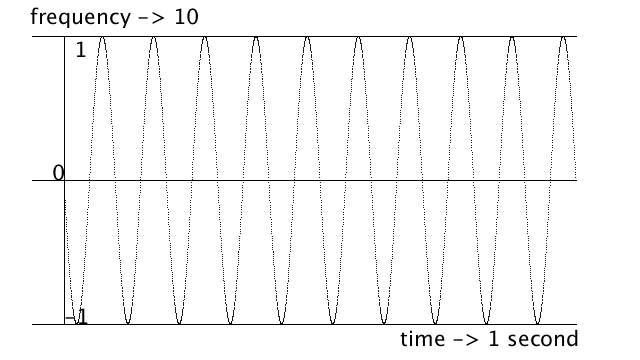
このfreq(振動数)が2、3、4…と増えていけば、一秒間に上下する波は増えます。よくAの音が440Hzと言いますが、これは一秒間に440回上下を繰り返しているということです
As freq (frequency) increases to 2,3,4..., the number of waves going up and down increases in a second. The A sound is often said to be 440Hz, which means it goes up and down 440 times a second.
y = sin( angle (radians(degree)) * 2 (freq) )
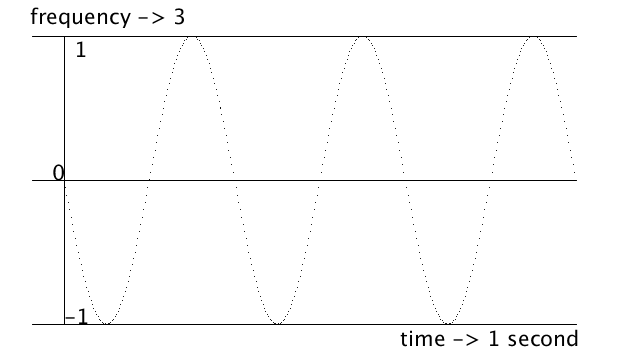
y = sin( angle (radians(degree)) * 3 (freq) )
y = sin( angle (radians(degree)) * 10 (freq) )
初期位相 The initial phase
初期位相とは簡単に説明すると、振動が始まる最初のyの位置です。 下のアニメーションを見ればすぐ理解できます。
In a nutshell, the initial phase is the position of y at which the oscillation begins. if you see it in the animation bellow, you can understand immediately.
y = sin( angle (radians(degree)) * 1 (freq) + radians(phi) (initial phase)
float t ? - 5:30 ~
float t ? - 5:30 ~
pointCount = width-250;
translate(250, height/2);
float t = ((float)frameCount/pointCount) % 1;
angle = map(t, 0, 1, 0, TWO_PI);
float x = cos(angle*freq + radians(phi));
さて、このコードですが、この"float t"とは一体何をしているのでしょうか。 前回説明したmap関数とProcessingのframeCountさえ理解できていればすぐに分かります。
So what does this "float t" do? If you already know the map function and the frameCount in Processing, which I discussed last time, you'll know.
Map関数は前回説明しましたので、 FrameCount変数のことを簡単に説明します。
The map function was previously described. Let's take a quick look at frameCount variable.
まずFPSとは、一秒間に何回イメージを描画するかを決める値です。
First, FPS is a value that determines how many times an image is rendered per second.
そして、FrameCountはイメージを何回画面に描画したかをカウントしています。
FrameCount counts how many times the image was drawn on the screen.
FPSが30の場合、一秒間に30回イメージが描画されます。 そして、一秒間にFrameCountは30増えます。 二秒経ったら、FrameCountは60になっています。
If FPS is 30. the image is drawn 30 times per second. The frameCount increases by 30 per second. After 2 seconds, frameCount is 60.
Pointcountとは正弦波の幅だと思ってください。
Think of PointCount as the width of a sine wave.
なぜPointcountかというと、Xの位置はピクセル毎に決められています。 すると、Xがとる範囲はPointCountの数だけあるということです。
The reason for PointCount is that the position of X is determined pixel by pixel. This means that X has a range equal to the number of PointCount.
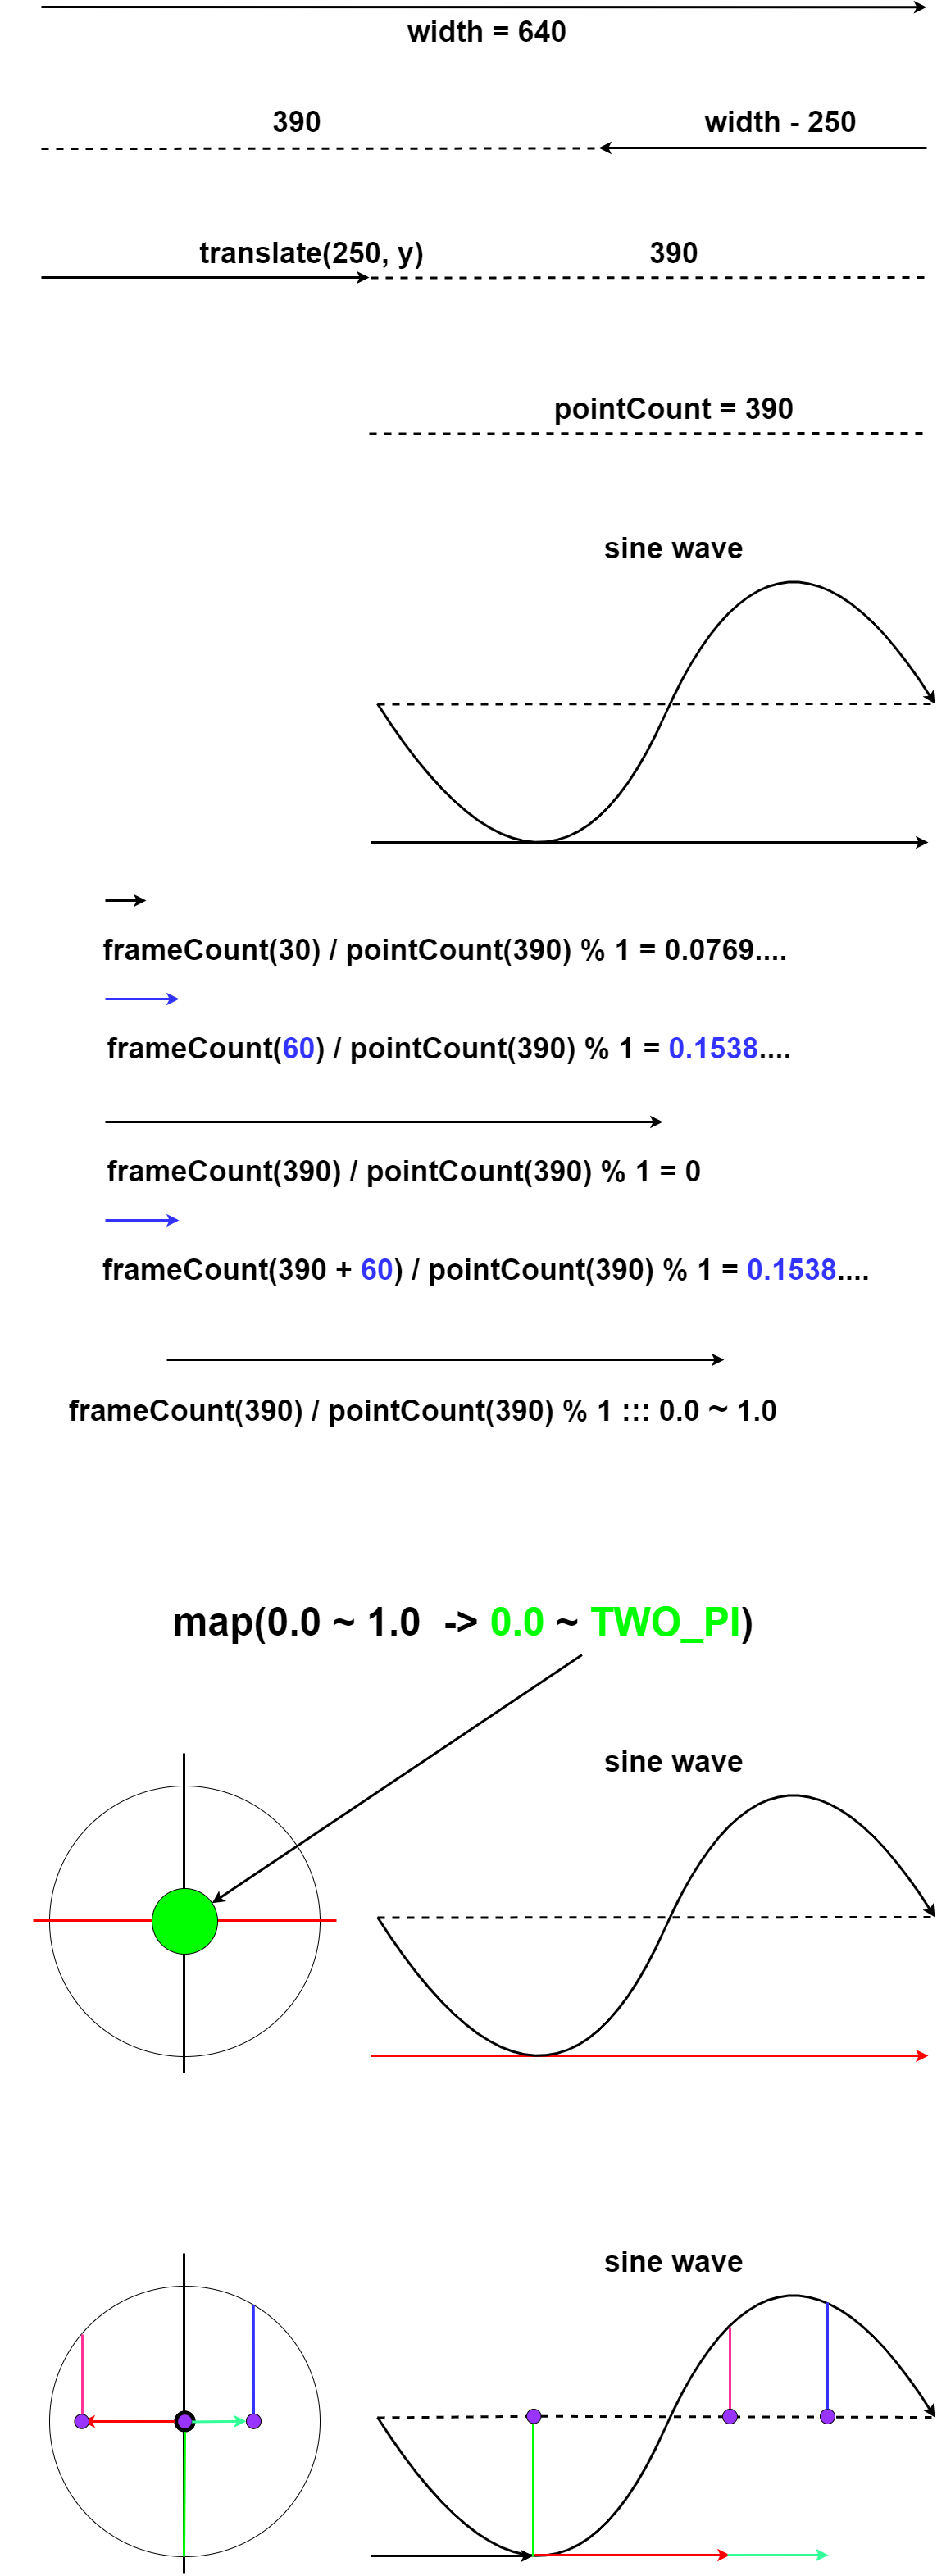
今回の場合Xの範囲はpointCount = width-250で、Size関数で決めた画面の横幅から250を引いた値、つまり390です。
In this case, the range of X is "pointCount = width - 250", which is 250 less the width of the screen as determined by the Size function, or 390.
なぜ250を引くかというと、Width変数には画面の横幅の値が入っています。 640なら、画面の右端を表していますので、ここから250を引けば、390。
The reason to subtract 250 is that the Width variable contains the screen width value. If it is 640, it represents the right edge of the screen, so if you subtract 250 from here, it is 390.
そして正弦波のX座標の始まりはTranslate関数を使用して250になります。 この位置からWidth(640)まで、正弦波の振動数が収まるようにするためには先程のPointCountを開始位置から足します。
The sine wave starts at 250 using the Translate function. To keep the frequency of the sine wave from this position to Width (640), add the pointCount from the start position.
pointCount = width-250;
          translate(250, height/2);
ここで正弦波と、それに対応して描画される円のアニメーションとしてXの動きを表現するために、 一秒間でXが進む値を調整しなければなりません。
In order to represent the motion of X as an animation of a sine wave and the corresponding circle drawn, You must adjust the value at which X advances in 1 second.
ここでFrameCountをPointCountで割ります。 PointCountが390、FrameCountが390なら1になります。
Now divide frameCount by pointCount. If pointCount is 390 and frameCount is 390, this is 1.
FPSが30なら、13秒後にXは終点に到達します。 26秒後なら30×26=780フレーム。 390で割ると2 ここで、FrameCountをPointCountで割った値の小数点が、13秒周期で一緒になることを利用します。
If FPS is 30, X will reach the end point after 13 seconds. After 26 seconds, it is 780 frames. (30 times 26) Dividing by 390 is 2. Here we use the fact that FrameCount divided by PointCount gives the same decimal point every 13 seconds.
例えば1秒後と14秒後のFrameCount割るPointCountは 1.07692307692307と2.07692307692307です。
For example, FrameCount divided by PointCount after 1 and 14 seconds. 1.07692307692307 and 2.07692307692307.
ここで割り算の余りを利用します。 つまり、1で割れば余りは同じ0.07692307692307です。
The remainder of the division is used here. That is, if you divide by 1, the remainder is the same 0.07692307692307.
これをほぼ全てのプログラミング言語共通のモジュロ演算子「%」を使って導きます。
We derive this using the common modulo operator "%" in almost all programming language.
float t = ((float)frameCount/pointCount) % 1;
これが"float t"の正体です。さらにtの使われ方の説明に続きます。
This is what "float t" is all about. This is followed by an explanation of how t is used.
angle = map(t, 0, 1, 0, TWO_PI);
float x = cos(angle*freq + radians(phi));
「(float)」は「キャスト」と言われていて、型の値を変換する機能をもっています。
"(float)" is called "Cast" and has the ability to convert type values.
この場合PointCountは最初にIntととして、宣言しているので、小数点を扱えるように「(float)」を使ってFloatに変換する必要があります。
In this case, pointCount is first declared as Int, so it needs to be converted to Float using "(float)" to handle decimal points.
最終的に同じ余りの数は0から1までの範囲をとりますので、 map関数を使用して、0からTWO_PI、角度に直すと0°から360°の範囲をとるように変換します。
Finally, the same remainder numbers range from 0 to 1. Use the map function to convert from 0 to TWO_PI, or from 0° to 360° when converted to an angle.
それをCosを使ってXの位置に変換すれば、円を描くXの座標位置はFrameCount毎に進みます。 同時に同じ速度で正弦波のXの位置も連動するようになります。
If you convert it to the X position using cos, the X coordinate position for drawing the circle advances every frameCount. At the same time, the X position of the sine wave will be linked at the same speed.
以上です。 今までの説明を簡単な図にしてまとめました。
That's all. I summarized the explanation so far in a simple diagram.
pointCount = width-250;
translate(250, height/2);
float t = ((float)frameCount/pointCount) % 1;
angle = map(t, 0, 1, 0, TWO_PI);
float x = cos(angle*freq + radians(phi));
プッシュ、ポップスタイルとアーク関数 - 10:00 ~
push-pop Style, and arc function - 10:00 ~
コードと図を見たほうが理解が早いです。
It's easier to understand if you look at the code and the diagram.
void setup() {
size(640, 360);
}
void draw() {
background(255);
textSize(18);
textAlign(CENTER);
fill(0);
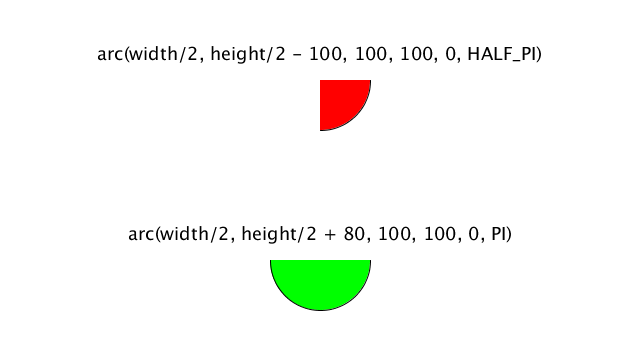
text("arc(width/2, height/2 - 100, 100, 100, 0, HALF_PI)", width/2, height/2 - 120);
fill(255, 0, 0);
arc(width/2, height/2 - 100, 100, 100, 0, HALF_PI);
fill(0);
text("arc(width/2, height/2 + 80, 100, 100, 0, PI)", width/2, height/2 + 60);
fill(0, 255, 0);
arc(width/2, height/2 + 80, 100, 100, 0, PI);
}
arc(弧の中心の座標X、Y、 X軸の長さ、Y軸の長さ、角度(ラジアン)スタート、エンド)
arc( The coordiantes of the center of the arc X, Y, the length of the X axis, the length of the Y axis, the angle (radian) Start, End)
次に示すのはマウスの動きで弧の角度と半径を変えるコードと、その結果の動画です。
Here's a code that changes the angle and radius of the arc as you move the mouse, and the resulting video.
void setup() {
  size(640, 360);
}

void draw() {
  background(255);
  textSize(18);
  textAlign(CENTER);

  float angle = map(mouseX, 0, width, -0.2, TWO_PI+0.2);
  float radius = map(mouseY, 0, height, 100, 300);
  fill(0);
  text("arc start : 0 -> end : " + angle, 200, 20);
  text("radius : " + radius, 450, 20);

  noStroke();
  fill(255, 0, 0);
  arc(width/2, height/2, radius, radius, 0, angle);
  fill(0, 0, 255);
  arc(width/2, height/2, radius*0.6, radius*0.6, -angle, 0);
}
pushStyleとpopStyleの説明です。 pushStyleとpopStyleで囲んだ中でカラーや大きさ等の設定をすると外部に影響を及ぼしません。
describes pushStyle and popStyle. If you set the color, size, etc, between the pushStyle and popStyle, it will not affect the outside.
コードと図を見たほうが理解が早いです。
It's easier to understand if you look at the code and the diagram.
boolean switchFunction;
void setup() {
size(640, 360);
switchFunction = false;
}
void draw() {
background(255);
textSize(18);
textAlign(CENTER);
fill(0);
//if (switchFunction == true) {
// pushAndpop();
//} else {
// notpushAndpop();
//}
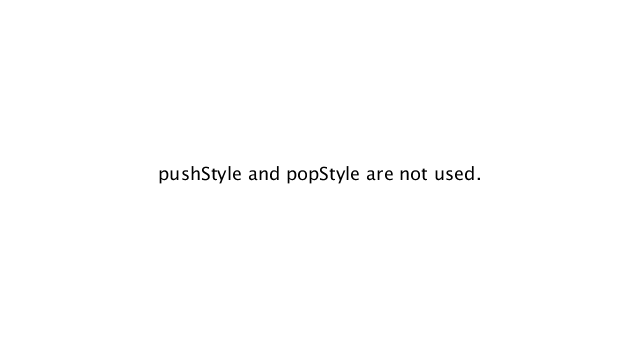
text("pushStyle and popStyle are not used.", width/2, height/2);
}
void notpushAndpop(){
textSize(30);
fill(255, 0, 0);
text("pushStyle and popStyle are not used.", width/2, height/2-100);
text("pushStyle and popStyle are not used.", width/2, height/2+100);
}
void pushAndpop(){
pushStyle();
textSize(30);
fill(255, 0, 0);
text("pushStyle and popStyle are used.", width/2, height/2-100);
text("pushStyle and popStyle are used.", width/2, height/2+100);
popStyle();
}
void keyPressed(){
if (key == '1') switchFunction = true;
if (key == '2') switchFunction = false;
}
最初に中央に文字をテキスト関数を使用して表示させます。
First, use a text function to display the character in the middle.
if (switchFunction == true) {
    pushAndpop();
} else {
    notpushAndpop();
}
次に、異なる設定のテキストを表示させる関数を入れてみます。
Next, let's put a function that displays text with different setting.
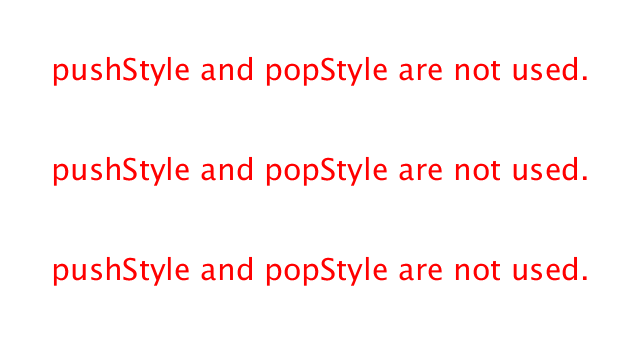
ご覧の通りPushStyleを使わないと最初のテキストの設定が書き換えられてしまっています。
As you can see, if you don't use PushStyle, the initial text settings will be rewritten.
textSize(18);
textAlign(CENTER);
fill(0);
-->  textSize(30);
-->  fill(255, 0, 0);
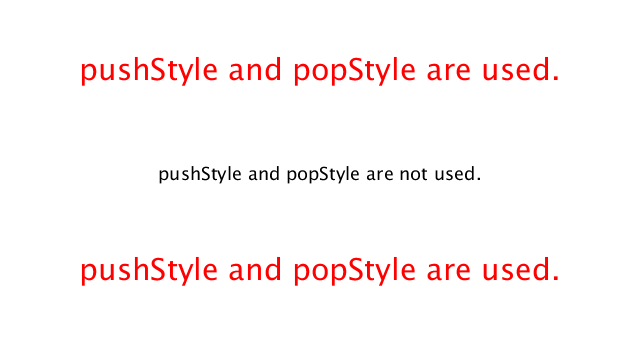
これを防ぎ、関数内での一時的な設定変更や順序を気にしないで設定を保ちたい場合はPushStyleを使うと便利です。
PushStyle is useful if you want to prevent this and keep your settings without having to worry about temporary changes or order in your functions.
void keyPressed(){
  if (key == '1') switchFunction = true;
  if (key == '2') switchFunction = false;
}
後はひたすらピクセル値を調整してグラフを作成していくだけです。
Now I explained it at length, all you have to do is just adjust the pixel values of the graph and text coordinates you plan to draw on the screen and create them.
残りは動画を見ながら感覚で理解できます。是非Processingを使って楽しみながら色々と試してみてください。
The rest can be understood intuitively while watching the video. Please try various things out while enjoying using Processing.