Published Date : 2021年2月12日17:50
3. 期待値を計算するAndroidアプリケーションの作成
3. Creating an Android Application to Calculate
Expectations
This blog has an English translation
ニコニコ動画にアップした動画のまとめ記事です。
This is a summary blog post about a video I uploaded to NicoNico.
細かい部分は動画を参考にしてください。
Please refer to the video for details.
目次
Table of Contents
① 動画の説明
① Video
Description
前回の続きです。
This is a continuation of the previous video.
Viewクラスを継承したDisplayViewクラスを作成したら、必要なライブラリをインポートします。
After you create the DisplayView class, which extends the View class, import the necessary libraries.
コンストラクタとonDrawメソッドを追加します。
Add the constructor and the onDraw method.
class DisplayView extends View {
    public DisplayView(Context context, ArrayList<Float> list) {

    }
    protected void onDraw(Canvas canvas) {

    }
}
テキストや図形の色等の情報を保持するPaintクラスの変数を宣言します。
Declare variables of the Paint class that hold information such as the color of text and geometry.
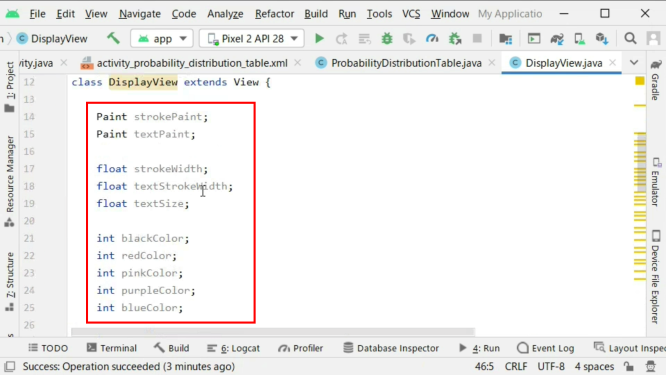
表の外枠の場合は線だけを表示する、テキストの場合は塗りつぶす等、図形やテキスト毎にスタイルを決めていく為、複数のPaint型の変数を用意します。
Multiple variables of type Paint are prepared to determine the style for each shape or text, such as displaying only lines in the case of the outer frame of the table, or filling in the case of text.
図形やテキストの色を指定する為の変数を宣言します。
Declare variables that specify the color of shapes and text.
図形やテキストの線の幅を細かく指定する為の変数を宣言します。
Declare variables to specify the line width of shapes and text.
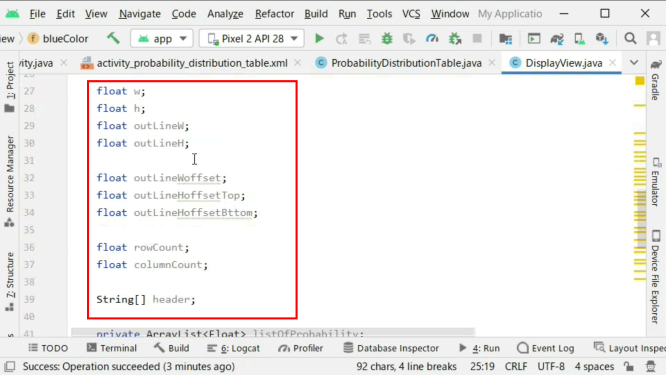
表を見やすくするため、ヘッダーを用意します。
Prepare a header to make the table easier to see.
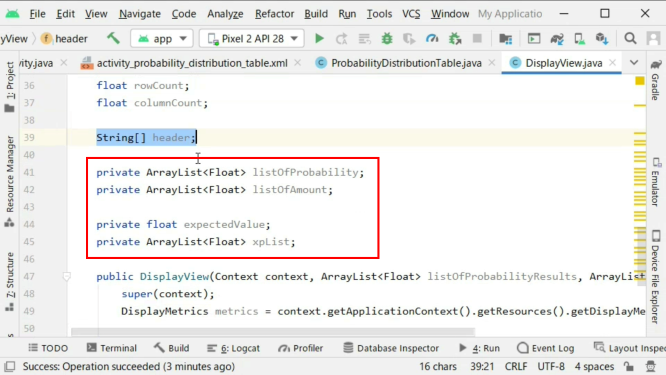
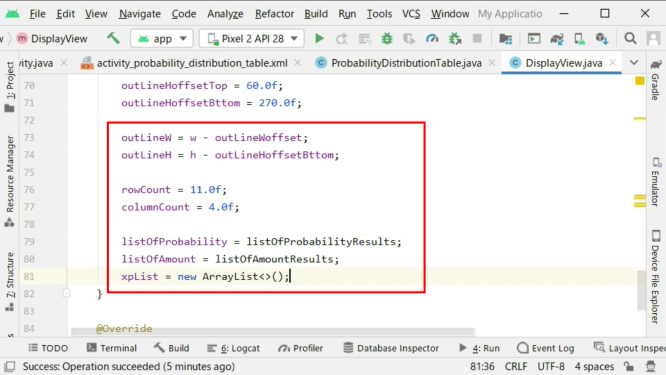
表に使う複数の配列を宣言します。
Declare multiple arrays for the table.
宣言した変数をコンストラクタ内で初期化していきます。
Initialize the variables declared in the constructor.
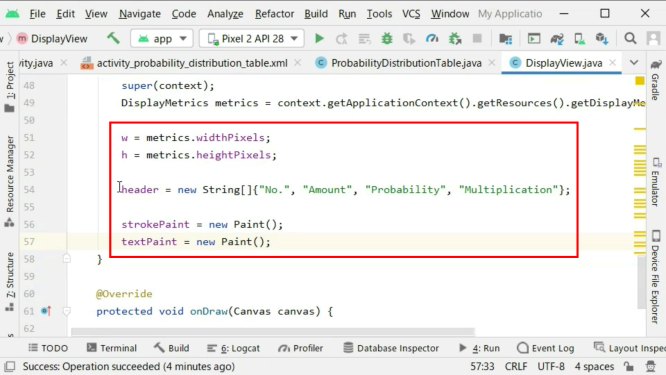
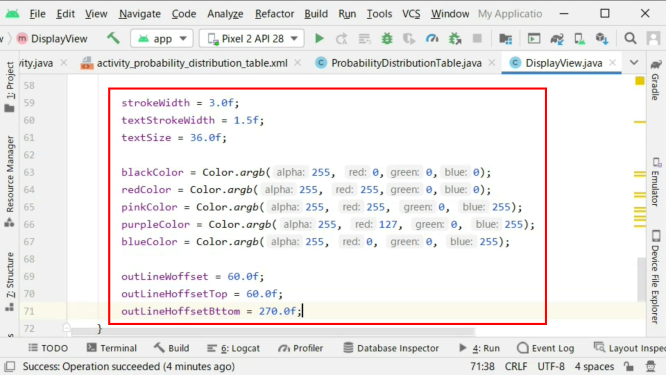
色や線の幅等は各自で好きなように調整してください。
Adjust the color and line width as you like.
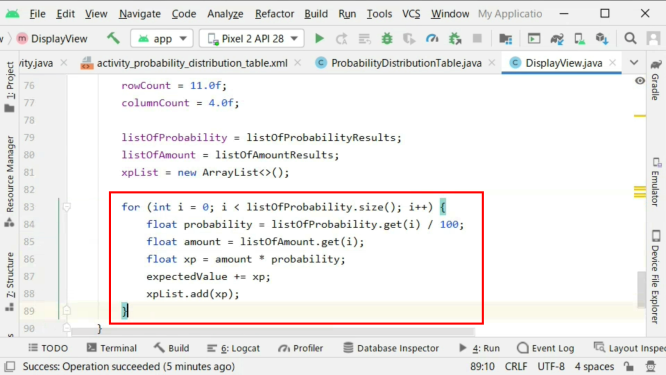
表で使用する各列に対する値を計算して各配列に格納していきます。
Calculates the value for each column used in the table and stores it in each array.
ではonDrawメソッド内の処理を書いていきます。
Now you will write the process in the onDraw method.
まずはコンストラクタ内で初期化したPaintオブジェクト変数に色や線の幅、どのように図形を塗りつぶすかの情報を設定していきます。
First, you set the color, line width, and how you want to fill the shape in the Paint object variable that you initialized in the constructor.
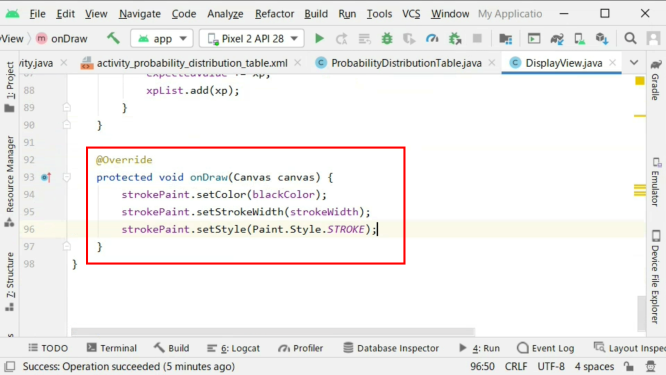
setStyleメソッド内で使われているSTROKEは線のみを描画、FILL_AND_STROKEは線も含めて指定された座標内を指定された色で塗りつぶすことを意味しています。
STROKE, used in the setStyle method, only draws lines, while FILL_AND_STROKE means to fill the specified coordinates, including lines, with the specified color.
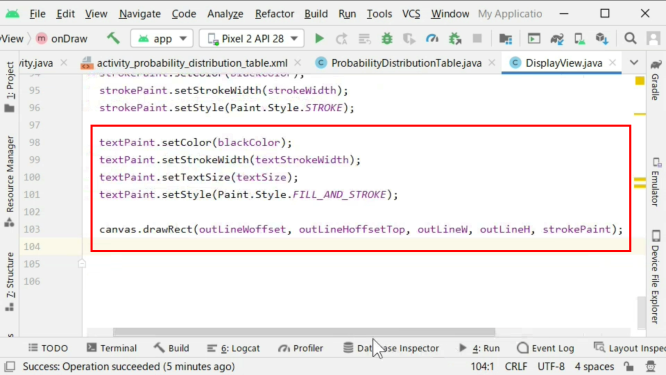
drawRectメソッドには左上のxとyの座標と右下のxとyの座標の四つの数値と、Paintオブジェクトを渡すことで、長方形を画面に描くことができます。
You can draw a rectangle on the screen by passing four numbers to the drawRect method, the upper left x and y coordinates, the lower right x and y coordinates, and a Paint object.
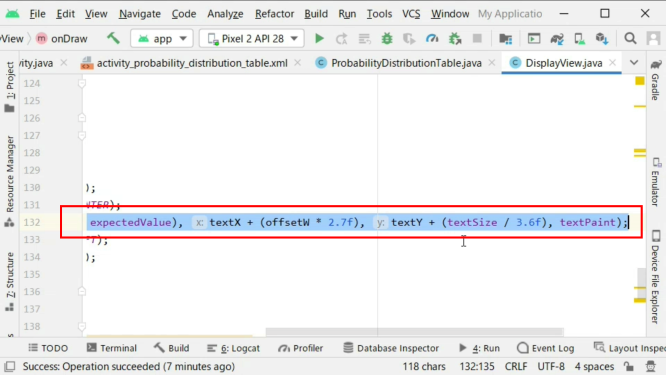
drawTextメソッドには表示したいテキストと、テキストのxとyの座標とPaintオブジェクトを渡してやれば、テキストを画面に表示できます。
You can use drawText to display text on the screen by passing the text you want to display, the x and y coordinates of the text, and a Paint object.
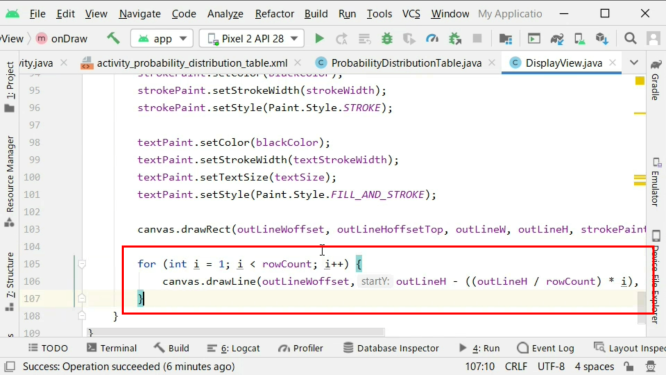
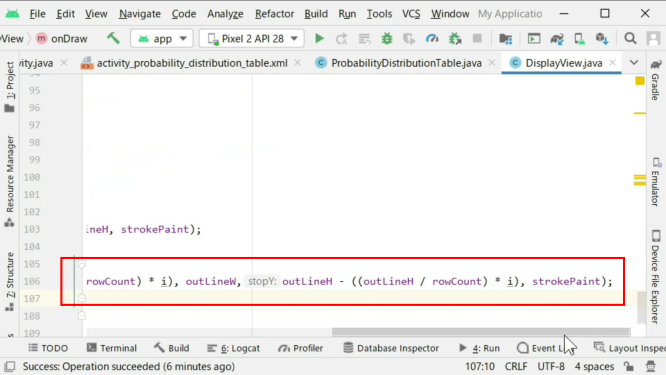
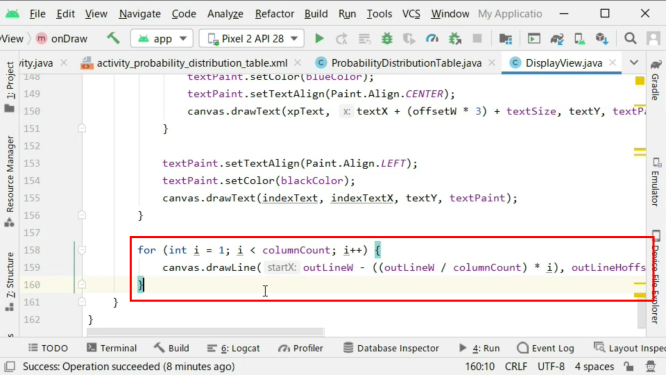
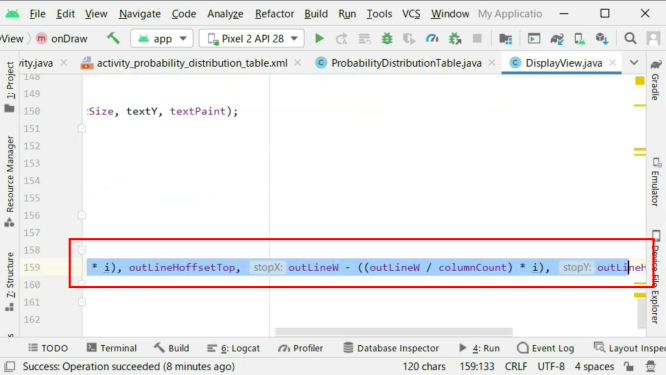
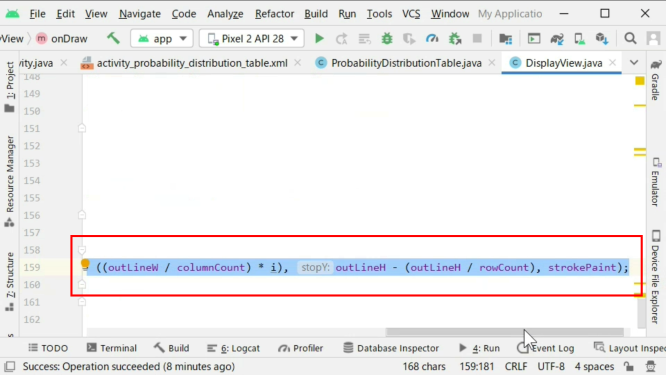
表の各行と列を表す線をdrawLineを使って描画していきます。
Draw lines to represent each row and column of the table using drawLine.
表の行やヘッダーの表示には別のForループ文を使用します。
You use a separate For loop statement to display table rows and headers.
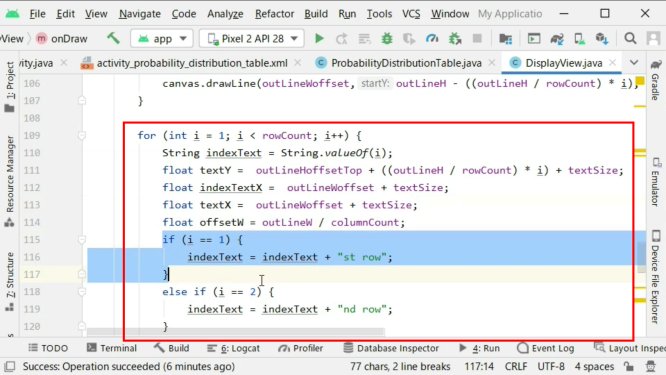
テキスト同士の間隔や、色や大きさ等を決めていきます。
You decide the space between texts, color and size.
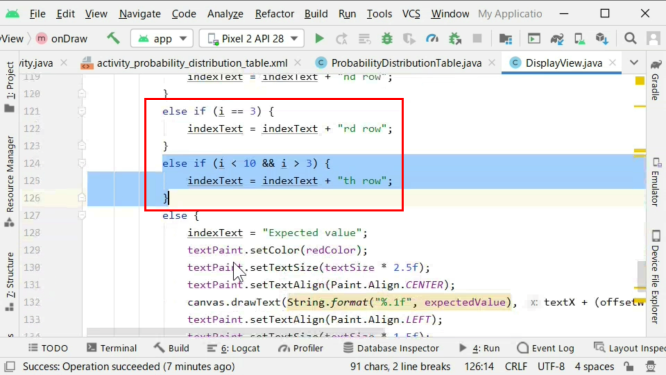
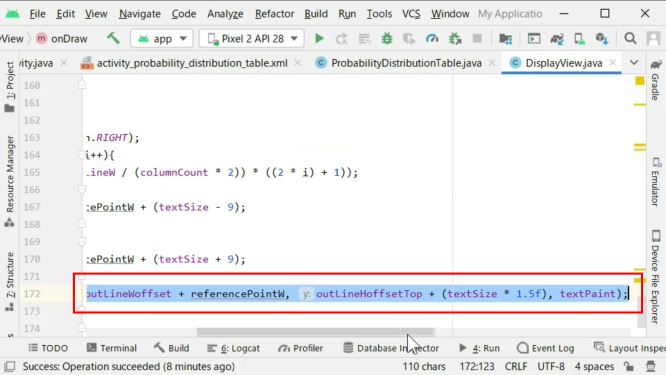
そしてインデックス番号を使ってヘッダー、各行の数値、期待値の計算結果の位置を決めていきます。
The index number is then used to position the header, the number of each row, and the result of the calculation of the expected value.
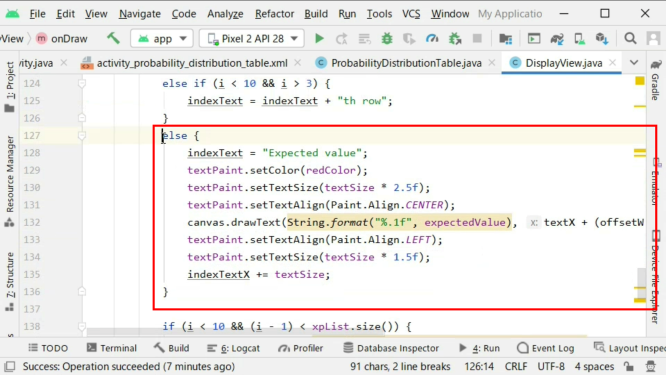
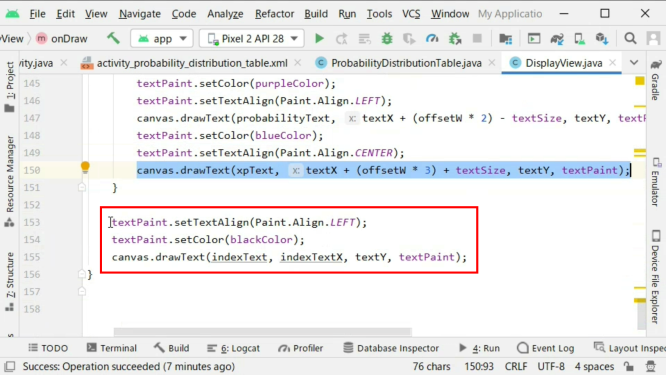
各数値を見やすくする為に、テキストの色をsetColorメソッドを使って変えていきます。
To make each number easier to see, we use the setColor method to change the color of the text.
フロート値を文字列に直す際に、Strings.Formatを使用すると、第一引数に指定した値で小数点第何位までを丸めて表示させるか決めることができます。
When converting float values to strings, you can use Strings.Format to determine how many decimal places are rounded off by the value specified in the first argument.
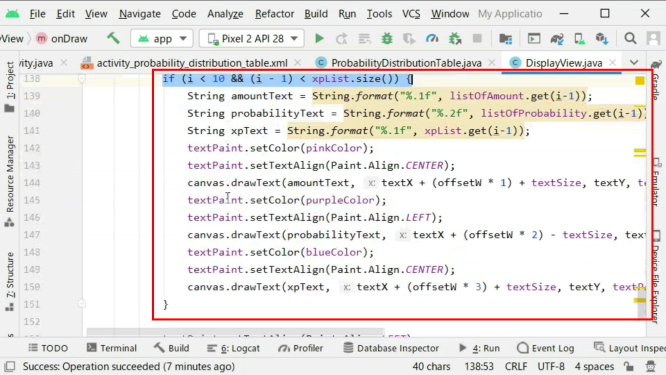
配列に格納されている各確率、各金額、そしてその両方を掛け合わせた数値を表示させていきます。
Displays each probability in the array, each amount, and the number multiplied by both in each row.
各数値を見やすくする為に、テキストの色をsetColorメソッドを使って変えていきます。
To make each number easier to see, we use the setColor method to change the color of the text.
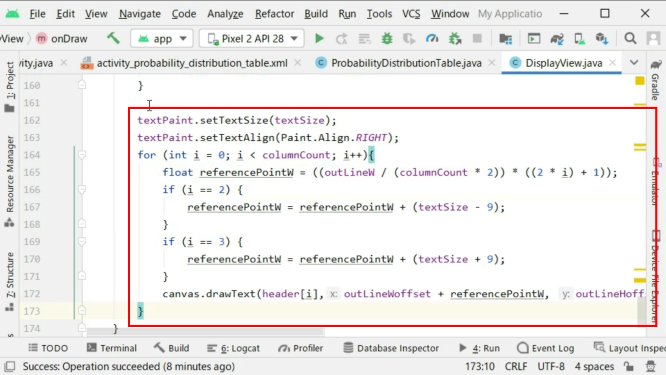
それぞれのテキスト毎にsetTextAlignを使用して表示位置を調整します。
Use setTextAlign to adjust the display position for each text.
今回はそれぞれのテキスト用に別々のPaintインスタンスを使用する代わりに、一つのPaintインスタンスの属性値を時折変えることによって色や表示位置、テキストサイズ等を調整しています。
This time, instead of using separate Paint instances for each text, I have chosen to adjust the color, position, and size of the text by changing the attribute values of a single Paint instance from time to time.
表の列に対しても同じように、線やテキストを表示させていきます。
Lines and text are displayed on the screen for table columns as they are for rows.
4つの線を引くと同時に4つのヘッダーのテキストを配置していきます。
Places four heading text when you draw four lines.
では全てのコードを書き終えたので、アプリの挙動を確かめてみましょう。
Now that you've written all the code, let's see how the app works.
様々な期待値を計算して遊んでみましょう。
Let's play with calculating various expectations.
各自で色々と試して、もっと良いアプリに仕上げてください。
Please try various things on your own and make it a better application.
以上です。お疲れ様です。
That's all. Thank you for your hard work.