Published Date : 2021年2月4日16:39
1. 成功確率を計算するAndroidアプリケーションの作成
1. Creating an Android Application to Calculate
the Probability of Success
This blog has an English translation
ニコニコ動画にアップした動画のまとめ記事です。
This is a summary blog post about a video I uploaded to NicoNico.
細かい部分は動画を参考にしてください。
Please refer to the video for details.
目次
Table of Contents
① 動画の説明
① Video
Description
今回作るAndroidのアプリはこのようになります。
This is the Android app we are going to make this time.
Android Studioの環境設定方法は以前の動画を参考にしてください。
See my previous video for how to set up the Android Studio.
前回の動画でPythonのFlaskを使って作成した成功確率を計算するアプリのAndroid版です。
This is the Android version of the application that calculates the probability of success, which was created in my previous video using Python's Flask.
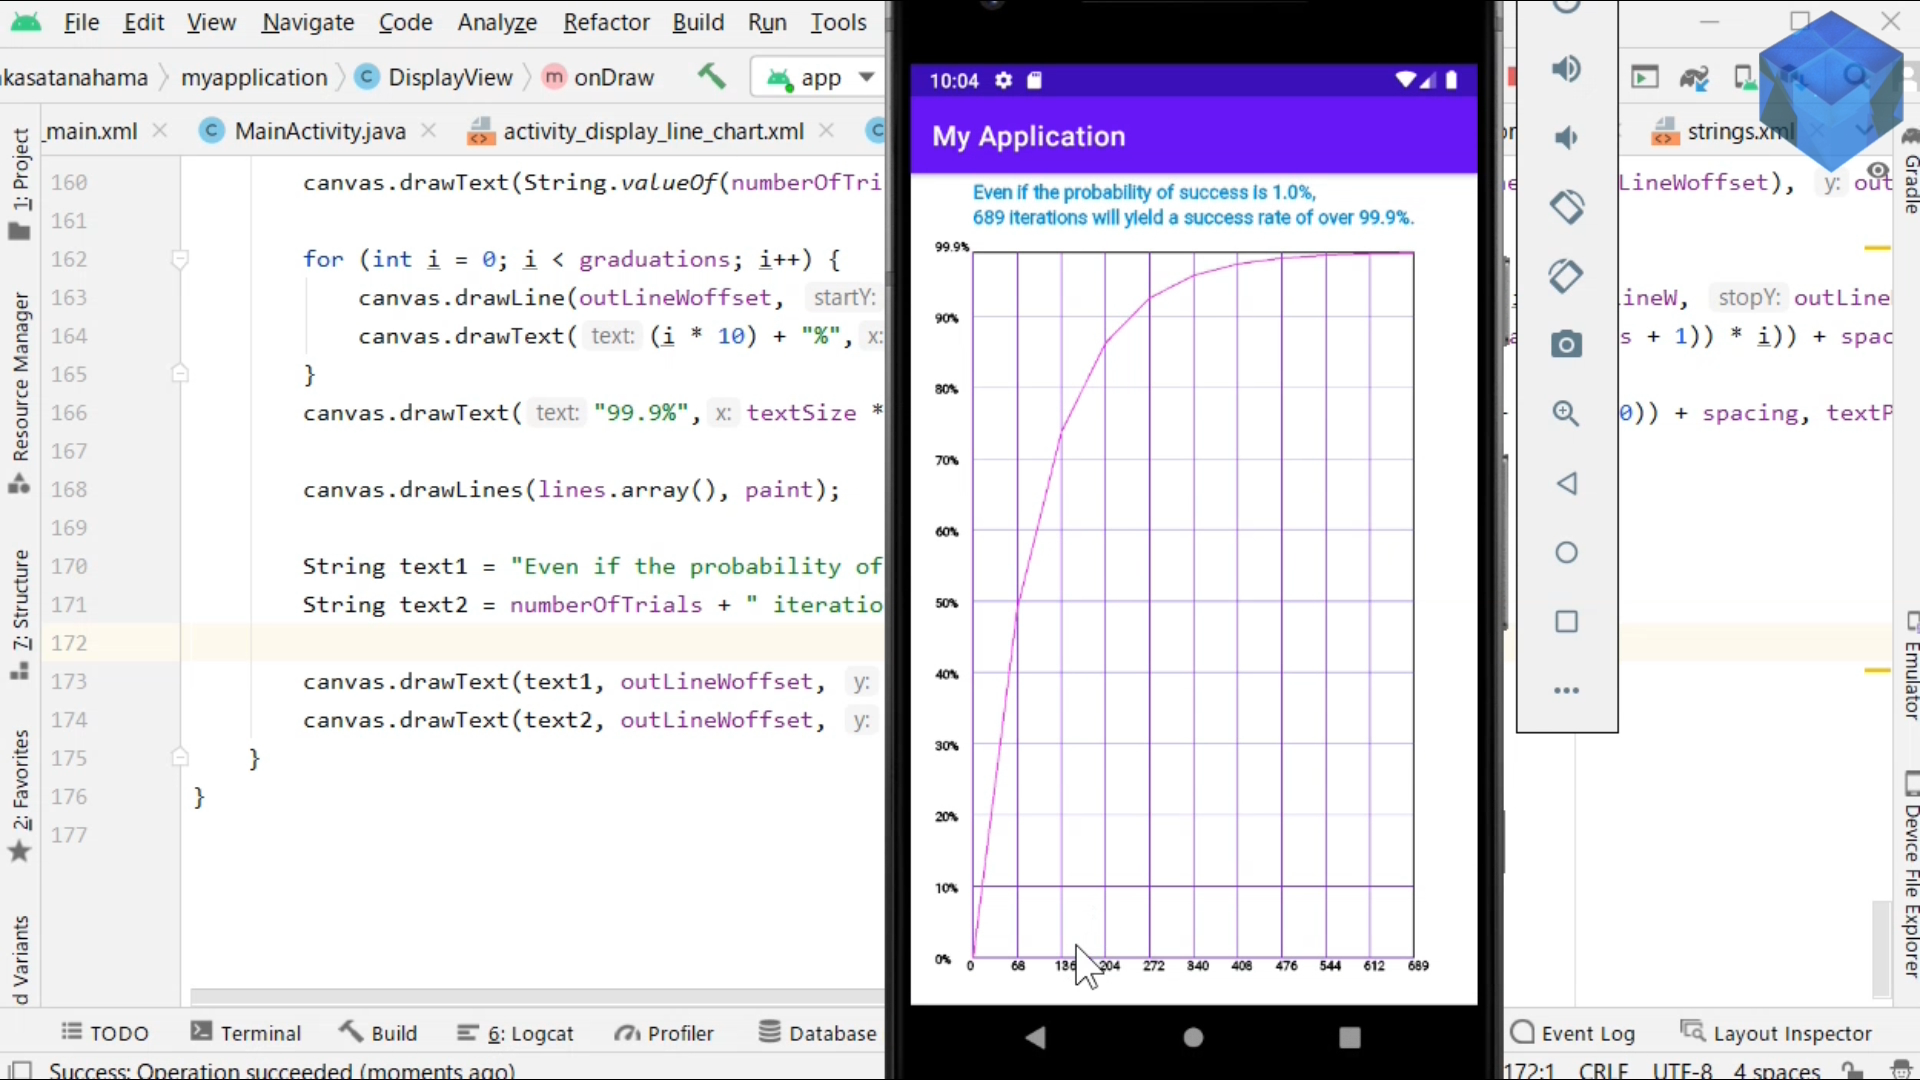
今回はユーザーが指定した確率から、試行回数毎の成功確率を折れ線グラフでも表示できるようにしてみました。
This time, I made it possible to display the probability of success for each trial number from the probability specified by the user in a line chart.
Androidアプリの作り方は以前の動画で何回か紹介しているので参考にしてみてください。
I've shown you how to make an Android app a few times before, so check it out.
ではいつも通りにAndroid Studioを立ち上げてから、空のアクティビティを選択して新しいプロジェクトを作成してください。
Start Android Studio as usual, then select an empty activity to create a new project.
プロジェクトの名前は好きなようにつけてください。分かりやすい名前が良いかもしれません。
Name the project as you like. An easy to understand name might be good.
そしてまた[App]で右クリックして、[new]ー>[Activity]ー>[Empty Activity]の順に選択して新しいアクティビティを作成しましょう。
Let's create a new activity by right clicking on [App] and selecting [new] ー> [Activity] ー>[Empty Activity].
折れ線グラフ用のアクティビティです。分かりやすい名前を付けましょう。
This is an activity to display a line chart. Please give it a name that is easy to understand.
[Generate a Layout file]にチェックを入れると、自動でレイアウトファイルを作ってくれます。
If you check [Generate a Layout file], the layout file will be created automatically.
[res]フォルダ内の[drawable]フォルダで右クリックして、[new]ー>[Drawable Resource File]の順に選択して新しいリソースファイルを作成します。
Right-click the [drawable] folder in the [res] folder to create a new resource file by selecting [new] ー> [Drawable Resource File].
ファイル名を[border.xml]にして、[shape]を使って外枠を作成します。
Name the file [border.xml] and use [shape] to create the border.
[values]フォルダ内の[strings.xml]ファイルにプロジェクト全般で使用するテキスト等を予め別で作成して登録しておきます。
In the [strings.xml] file in the [values] folder, create and register the text, etc. to be used for the entire project separately.
[layout]フォルダ内の[activity_main.xml]ファイルに[Grid Layout]を配置して、[columnCount]を2列、[rowCount]を6行に設定します。
Place [Grid Layout] in the [activity_main.xml] file in the [layout] folder, with [columnCount] set to 2 columns and [rowCount] set to 6 rows.
タイトル用のテキストビューを設置して、0行目(つまり最初の行)に設定し、カラムスパンを最初に指定した列と同じ数にして、真ん中に設定します。
Set up a text view for the title, set it to line 0 (That is, the first line), set the number of column spans to the same number as the first column specified, and set it in the middle.
次にユーザーに数値を入力させるためのエディットテキストを2列、それらのラベルとしてテキストビューを2列配置します。
It then arranges two columns of edit text for users to enter numbers, and two columns of text view for their labels.
インプットタイプをナンバーデシマルとナンバーサインドにすることによって入力する値を数値に限定することができます。
You can limit the input values to numerical values by setting the input type to numberDecimal and numberSigned.
計算ボタンを真ん中に配置して、onClickにイベントハンドラーを登録します。
Place the compute button in the middle and register the event handler in onClick.
そして、計算結果を表示するテキストビューを設置して、[background属性]に[border.xml]を指定し外枠を付けます。
Then, set up a text view to display the calculation result, and specify [background attribute] as [border.xml] to place an outline around it.
折れ線グラフを表示するアクティビティへ移動するためのボタンを配置します。
Places a button to go to an activity that displays a line chart.
[visibilty]を[invisible]にしてボタンの初期表示を非表示にし、計算結果が出たらボタンを表示させるようにします。
To create a mechanism for displaying the button when the result of the calculation comes out, set [visibilty] to [invisible] to hide the initial display of the button.
<Button
    android:id="@+id/showChartBtn"
    android:layout_row="5"
    android:layout_column="0"
    android:layout_columnSpan="2"
    android:layout_gravity="center_horizontal"
    android:layout_margin="30dp"
    android:onClick="showChartBtn"
    android:text="@string/chartActivityBtn"
    android:visibility="invisible" />
[Java]フォルダ内にある、[MainActivity.java]を開いて、Class内で使用する変数を書いていきましょう。
In the [Java] folder, open [MainActivity.java] and write the variables to be used in Class.
MainActivity内のコードが、レイアウトファイル内のボタンとテキストを操作できるように、そのファイル内で指定されたIDを使用してインスタンスを作成します。
Creates an instance using the ID specified in the layout file so that the code in MainActivity can manipulate buttons and text in that file.
計算結果の表示に必要な確率や試行回数等の変数を初期化します。
Initializes variables such as probability and number of trials required to display calculation results.
計算ボタンが押された時に実際に計算を行うメソッドを作成していきましょう。
Let's create a method that does the actual computation when the compute button is pressed.
まず、トーストを利用して、何も入力されなかった時にボタンが押されたら、小さなポップアップメッセージを画面い表示させるようにします。
First, I use toast to display a small pop-up message when a button is pressed when nothing is entered.
ポップアップメッセージの表示時間を短めにしたいので、ディレーションに[Toast.LENGTH_SHORT]を指定します。
To reduce the display time of pop-up messages, set the duration to [Toast.LENGTH_SHORT].
トーストのインスタンスを作成して、ポップアップメッセージの表示場所が画面の中央になるようにsetGravityを使って設定します。
Create an instance of the toast and use setGravity to center the pop-up message on the screen.
エディットテキストから確率と試行回数の数値を取り出し、変数に収めます。
Takes the probability and number of trials from the edit text and stores them in a variable.
片方の内どちらかが入力されなかった場合にポップアップメッセージを表示させます。
Displays a pop-up message if one of the two is not entered.
if(posText.equals(""))
{
    toast1.show();
}
else if(noaText.equals(""))
{
    toast2.show();
}
else
{
}
実際にトーストを使ったポップアップメッセージがどのように動作するのかを見てみましょう。
Let's see how pop-up messages using toast actually work.
[MainActivity.java]の続きに戻り、計算の処理を書いてきましょう。
Let's go back to [MainActivity.java] and write the calculation process.
テキストをフロートバリューに戻して、確率を計算して、HTMLの書式に計算結果の各変数を加えていきます。
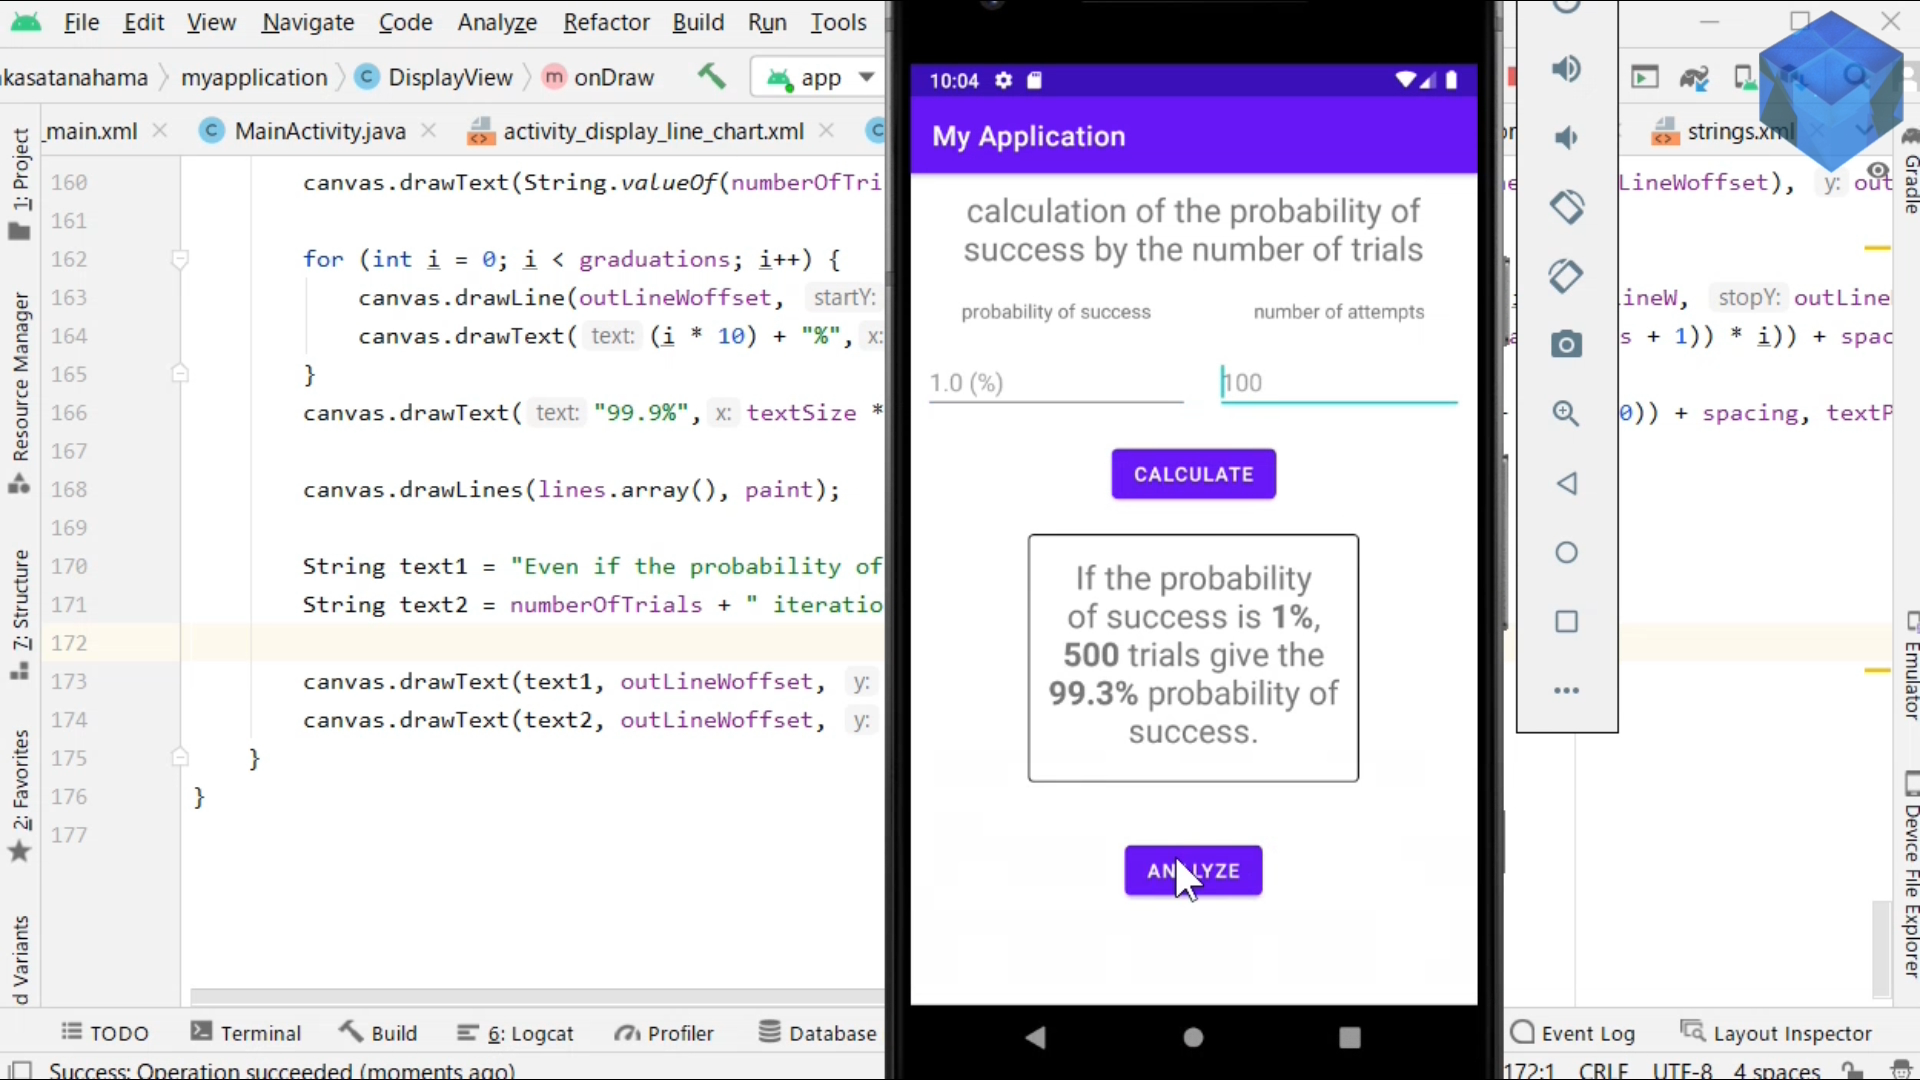
Return the text to its float value, calculate the probability, and add the resulting variables to the HTML format.
そのHTMLを結果を表示するテキストビューにセットして、確率と試行回数を入力する箇所をクリアします。
Set the HTML to a text view that displays the results and clear the entry for probability and number of attempts.
String resultText = "If the probability of success is <b>"
        + posText + "%</b>, <b>"
        + noaText + "</b> trials give the <b>"
        + String.format("%.1f", possibility) + "%</b> probability of success.";
resultView.setText(Html.fromHtml(resultText));
そして、折れ線グラフを表示するアクティビティへ変移させるボタンを表示させます。
Then, it displays a button to shift to an activity that displays a line chart.
パート2へと続く。
Continue to Part 2.
以上です。お疲れ様です。
That's all. Thank you for your hard work.