Published Date : 2019年12月15日2:41
p5.jsを使ってCSVファイルからグラフを作成する ~ 其の2 ~
Create a graph from a CSV file using p5.js – Part 2
This blog has an English translation
今回はp5.jsを使って、CSVファイルからデータを読み取り、それをグラフ化する事を試してみました。後半です。
This time I tried using p5.js to read data from a CSV file and graph it. The second half.
久しぶりにp5.jsを使ってみたくなり、復習も兼ねているので、基礎的な内容になります。
I want to use p5.js for the first time in a while, and it also serves as a review, so it's a basic content.
作ったグラフは一つ前の記事に貼り付けてあります。
The graph I created is shown in the previous blog post.
ロードに時間がかかりますが、p5.jsはお絵かきソフトに数値を入力するようにプログラミングできるので、やりたいことがすぐ具現化できるところが最大のメリットです。
It takes time to load, but the biggest advantage of p5.js is that you can do what you want right away because you can program like entering numbers into drawing software.
それでは前回の続きを書いていきます。
Then, I will write the continuation of the last time.
目次
Table of Contents
p5.jsファイルの説明 setup関数
Description of p5.js file (setup function)
では前回の続きから始めます。
Let's get start with continued from the last time.
date = table.getColumn('Date');
open = table.getColumn('Open');
high = table.getColumn('High');
low = table.getColumn('Low');
close = table.getColumn('Close');
adjClose = table.getColumn('Adj Close');
volume = table.getColumn('Volume');
tableオブジェクトのgetColumnメソッドを使い、列ごとのリストを取得します。
Use the getColumn method of the table object to get a list for each column.
tableオブジェクトの簡単な説明は前回行っています。
The table object has been briefly described previously.
textAlign(CENTER);

push();
strokeWeight(1);
text('Graph style', 45, 20);
pop();
続いて、textAlign(CENTER)を使いText表示を中央寄せにするよう設定します。
Then use textAlign(CENTER) to center the text display.
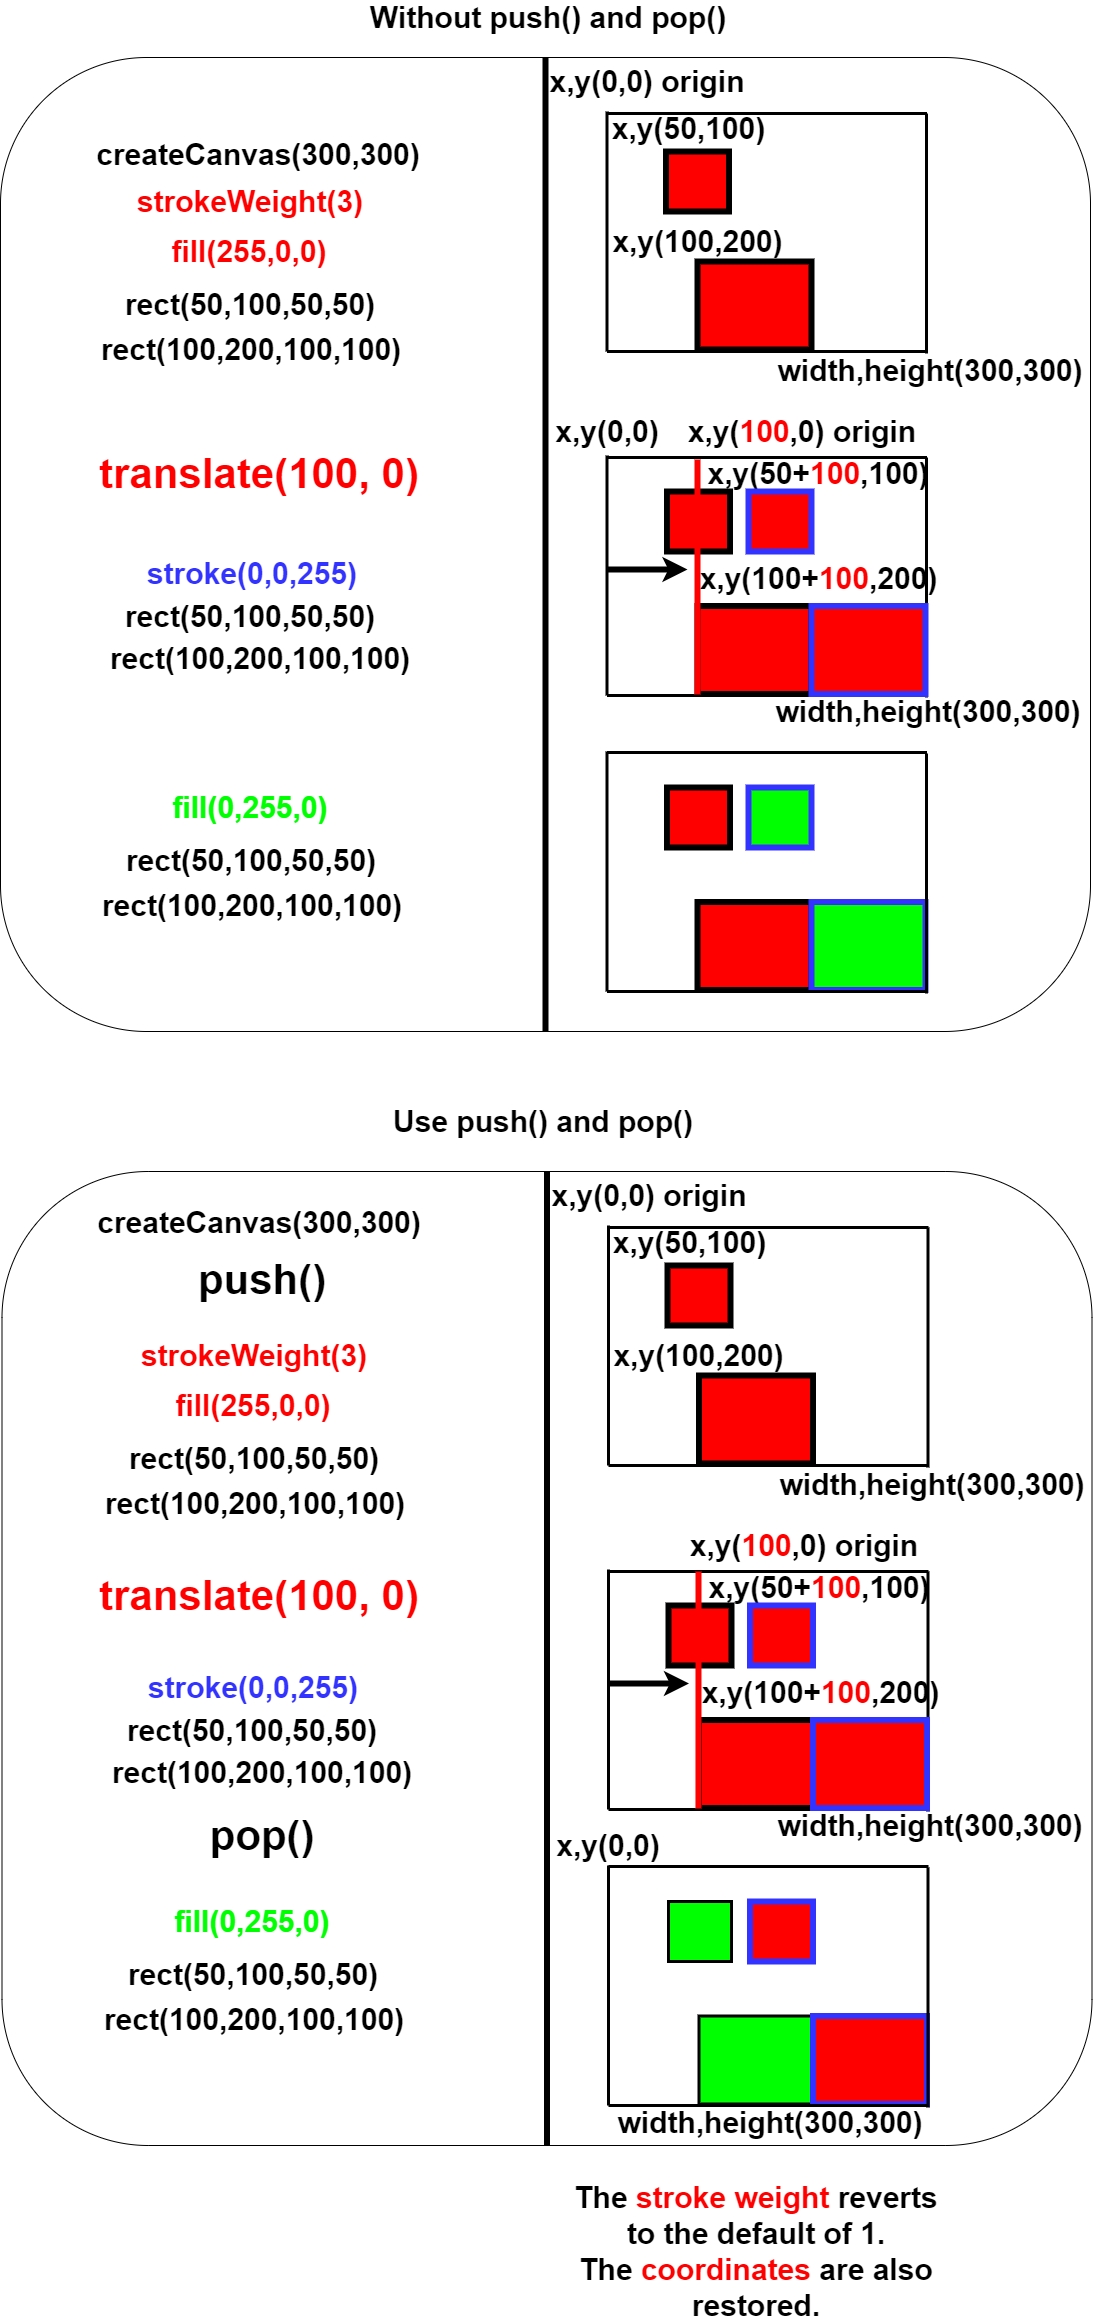
ここで、このスクリプトで頻繁に使用しているpush();とpop();を簡単に説明します。
Here is a brief description of the push(); and pop(); that are frequently used in this script.
push()とpop()はセットで使われます。 push()とpop()で囲われた箇所の、図形の色や場所等の設定は、他に影響を及ぼさないということです。
push() and pop() are used in pairs. Settings such as the color and the position of the graphic in the area surrounded by push() and pop() have no effect on other graphics.
gstyle = createSelect();
gstyle.position(85, 5);
gstyle.option('normal');
gstyle.option('bar');
gstyle.changed(toggleDuration);
このcreateSelect()はp5.jsのDOMライブラリにあるメソッドです。 HTML内にセレクトエレメントを作り、p5.js(Javascript)で操作できるようにします。
The createSelect() method is available in the p5.js DOM library. Creates a select element in HTML that can be manipulated by p5.js (Javascript).
DOM(Document Object Model)を簡単に図で説明します。
Let's take a quick look at the DOM (Document Object Model) using diagrams.
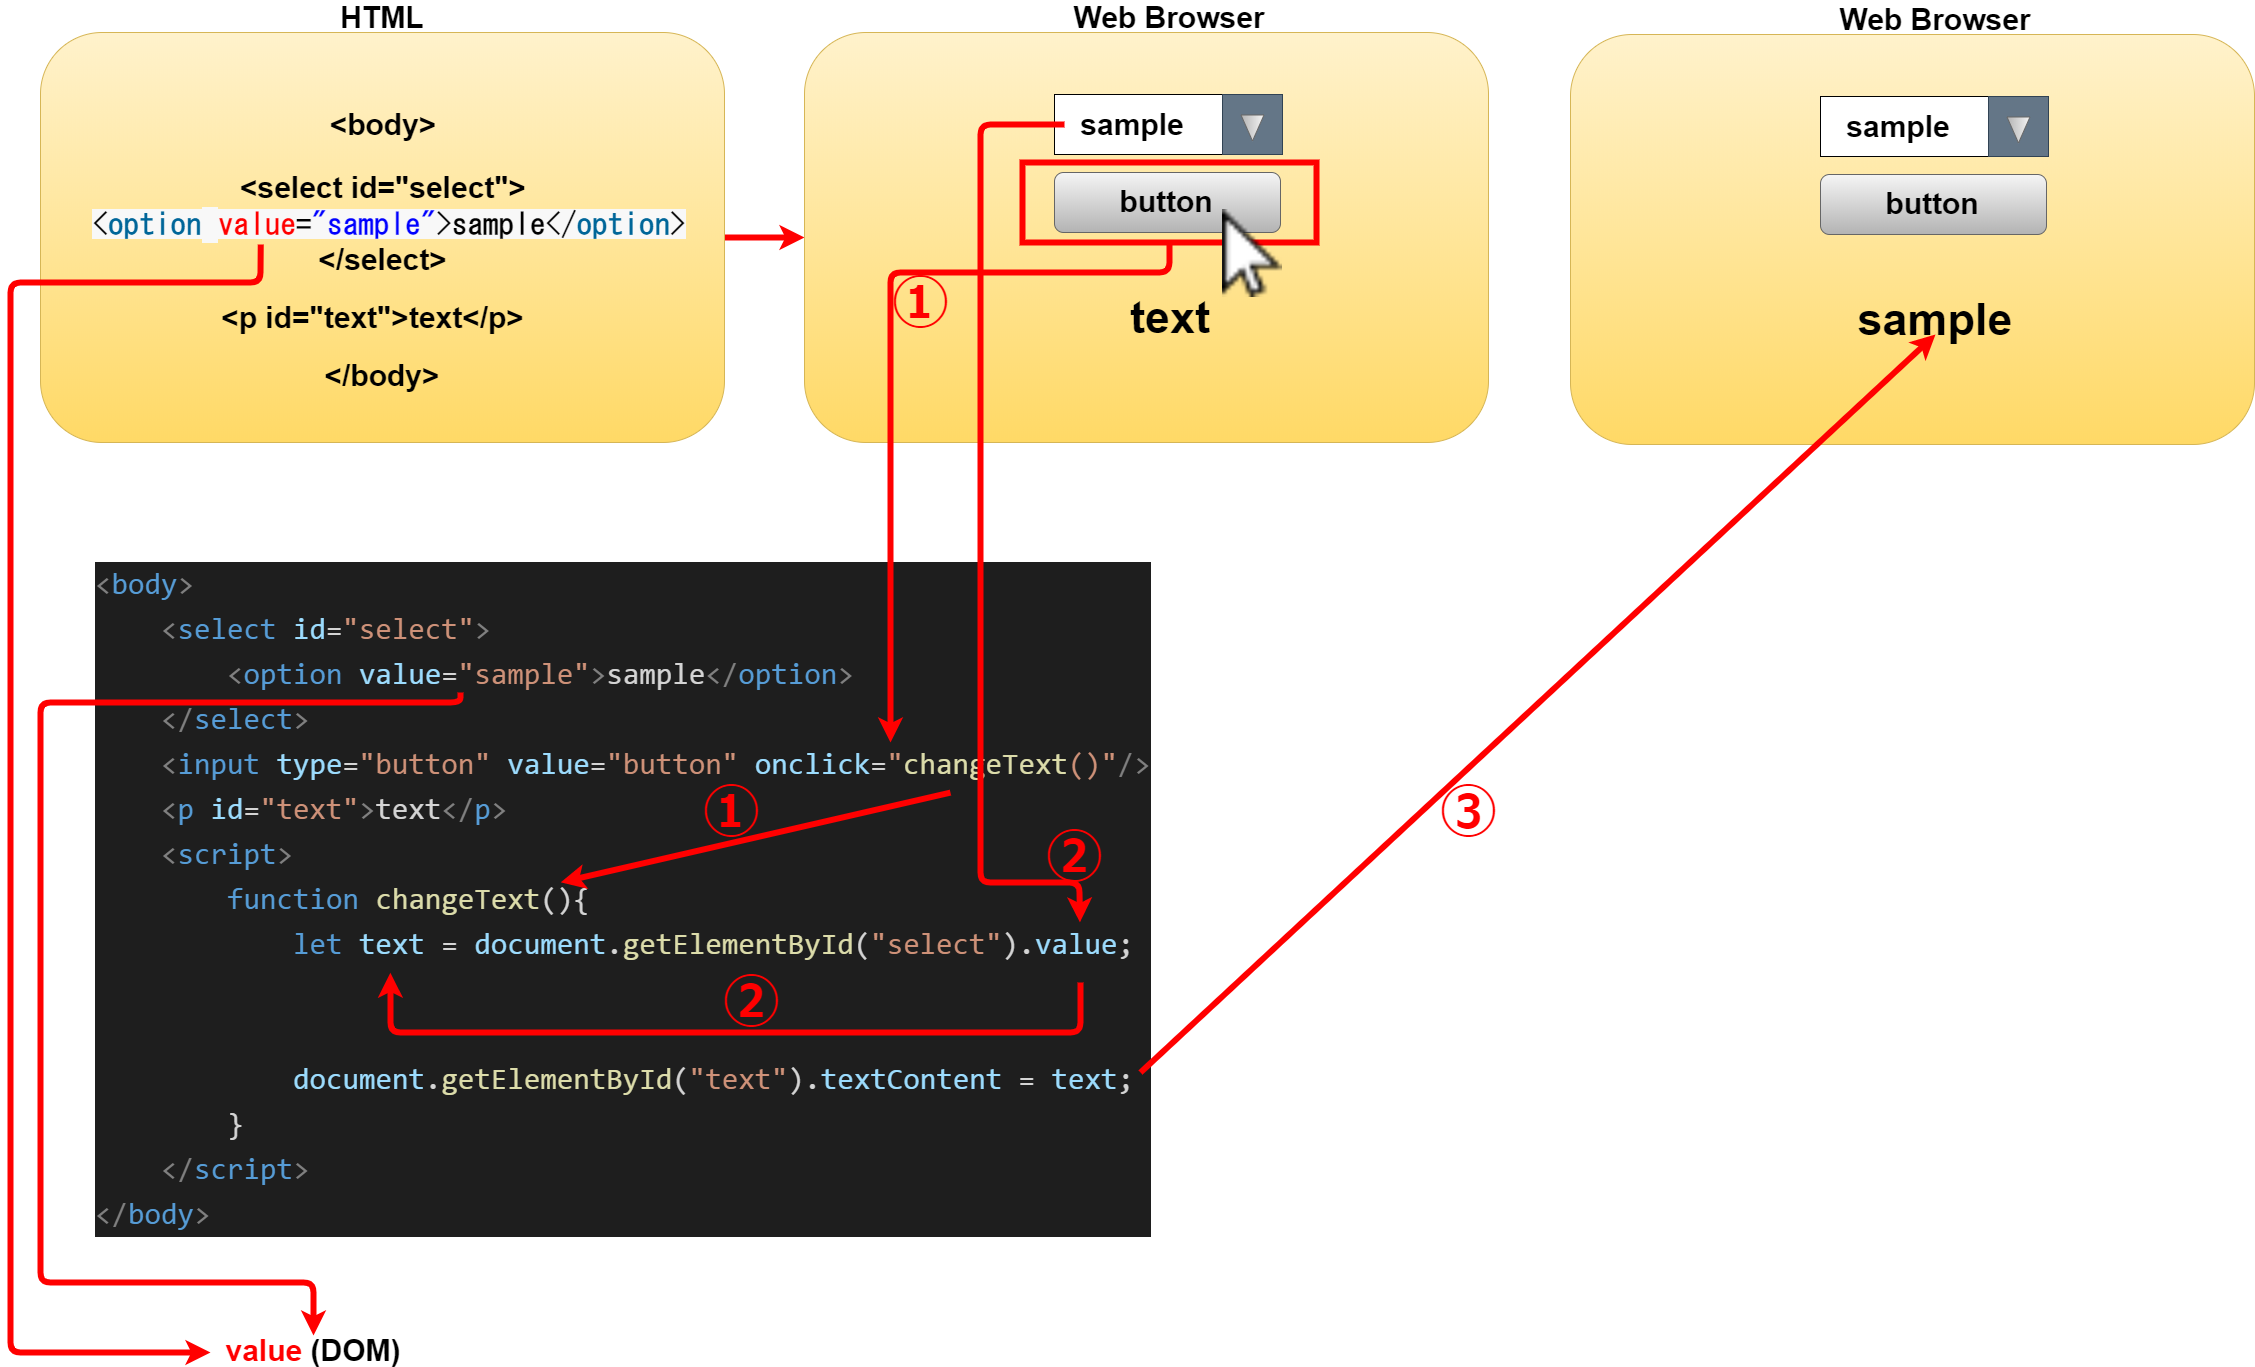
この場合、SelectタグのOptionの値、ValueをDOMといい、 Javascriptによって操作され、テキストの表示を変える働きに関連しています。
In this case, the Option value of Value in the Select tag is called DOM and is manipulated by Javascript to relate to changing the text.
push();
strokeWeight(1);
text('Date range', 190, 20);
pop();
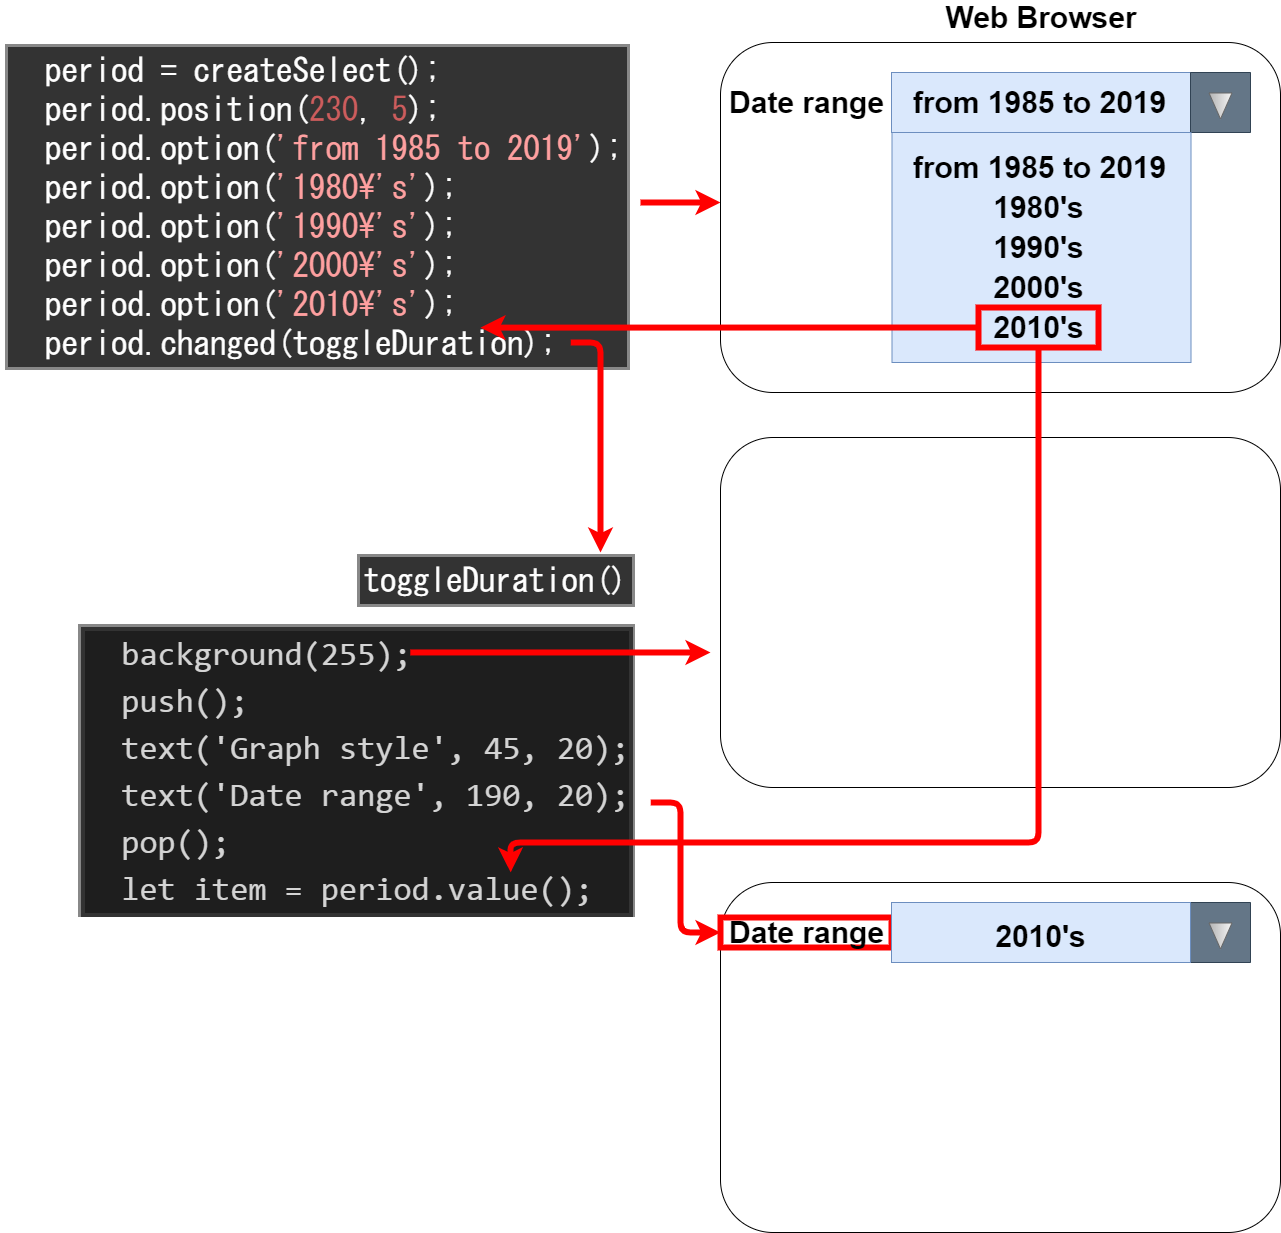
period = createSelect();
period.position(230, 5);
period.option('from 1985 to 2019');
period.option('1980\'s');
period.option('1990\'s');
period.option('2000\'s');
period.option('2010\'s');
period.changed(toggleDuration);
このように、セレクトタグの場所やオプション作成、DOMによる操作準備をJSだけで簡単に記述できるのがP5JSのDOMライブラリの利点です。
The advantage of the p5.js DOM library is that you can easily describe the location of select tags, the creation of options, and the preparation of operations with the DOM in JS.
// Default Draw
defaultDraw = new DrawGraph('normal', 1, 1984, 2019, true);
defaultDraw.display();
この箇所の説明は後ほどします。
I'll explain this part later.
function toggleDuration()の説明
Description of function toggleDuration()
SelectタグのDOMが操作された時に発動されるfunction toggleDuration関数の簡単な説明です。
Here is a brief description of the toggleDuration function that is invoked when the Select tag's DOM is manipulated.
function toggleDuration() {
background(255);
push();
text('Graph style', 45, 20);
text('Date range', 190, 20);
pop();
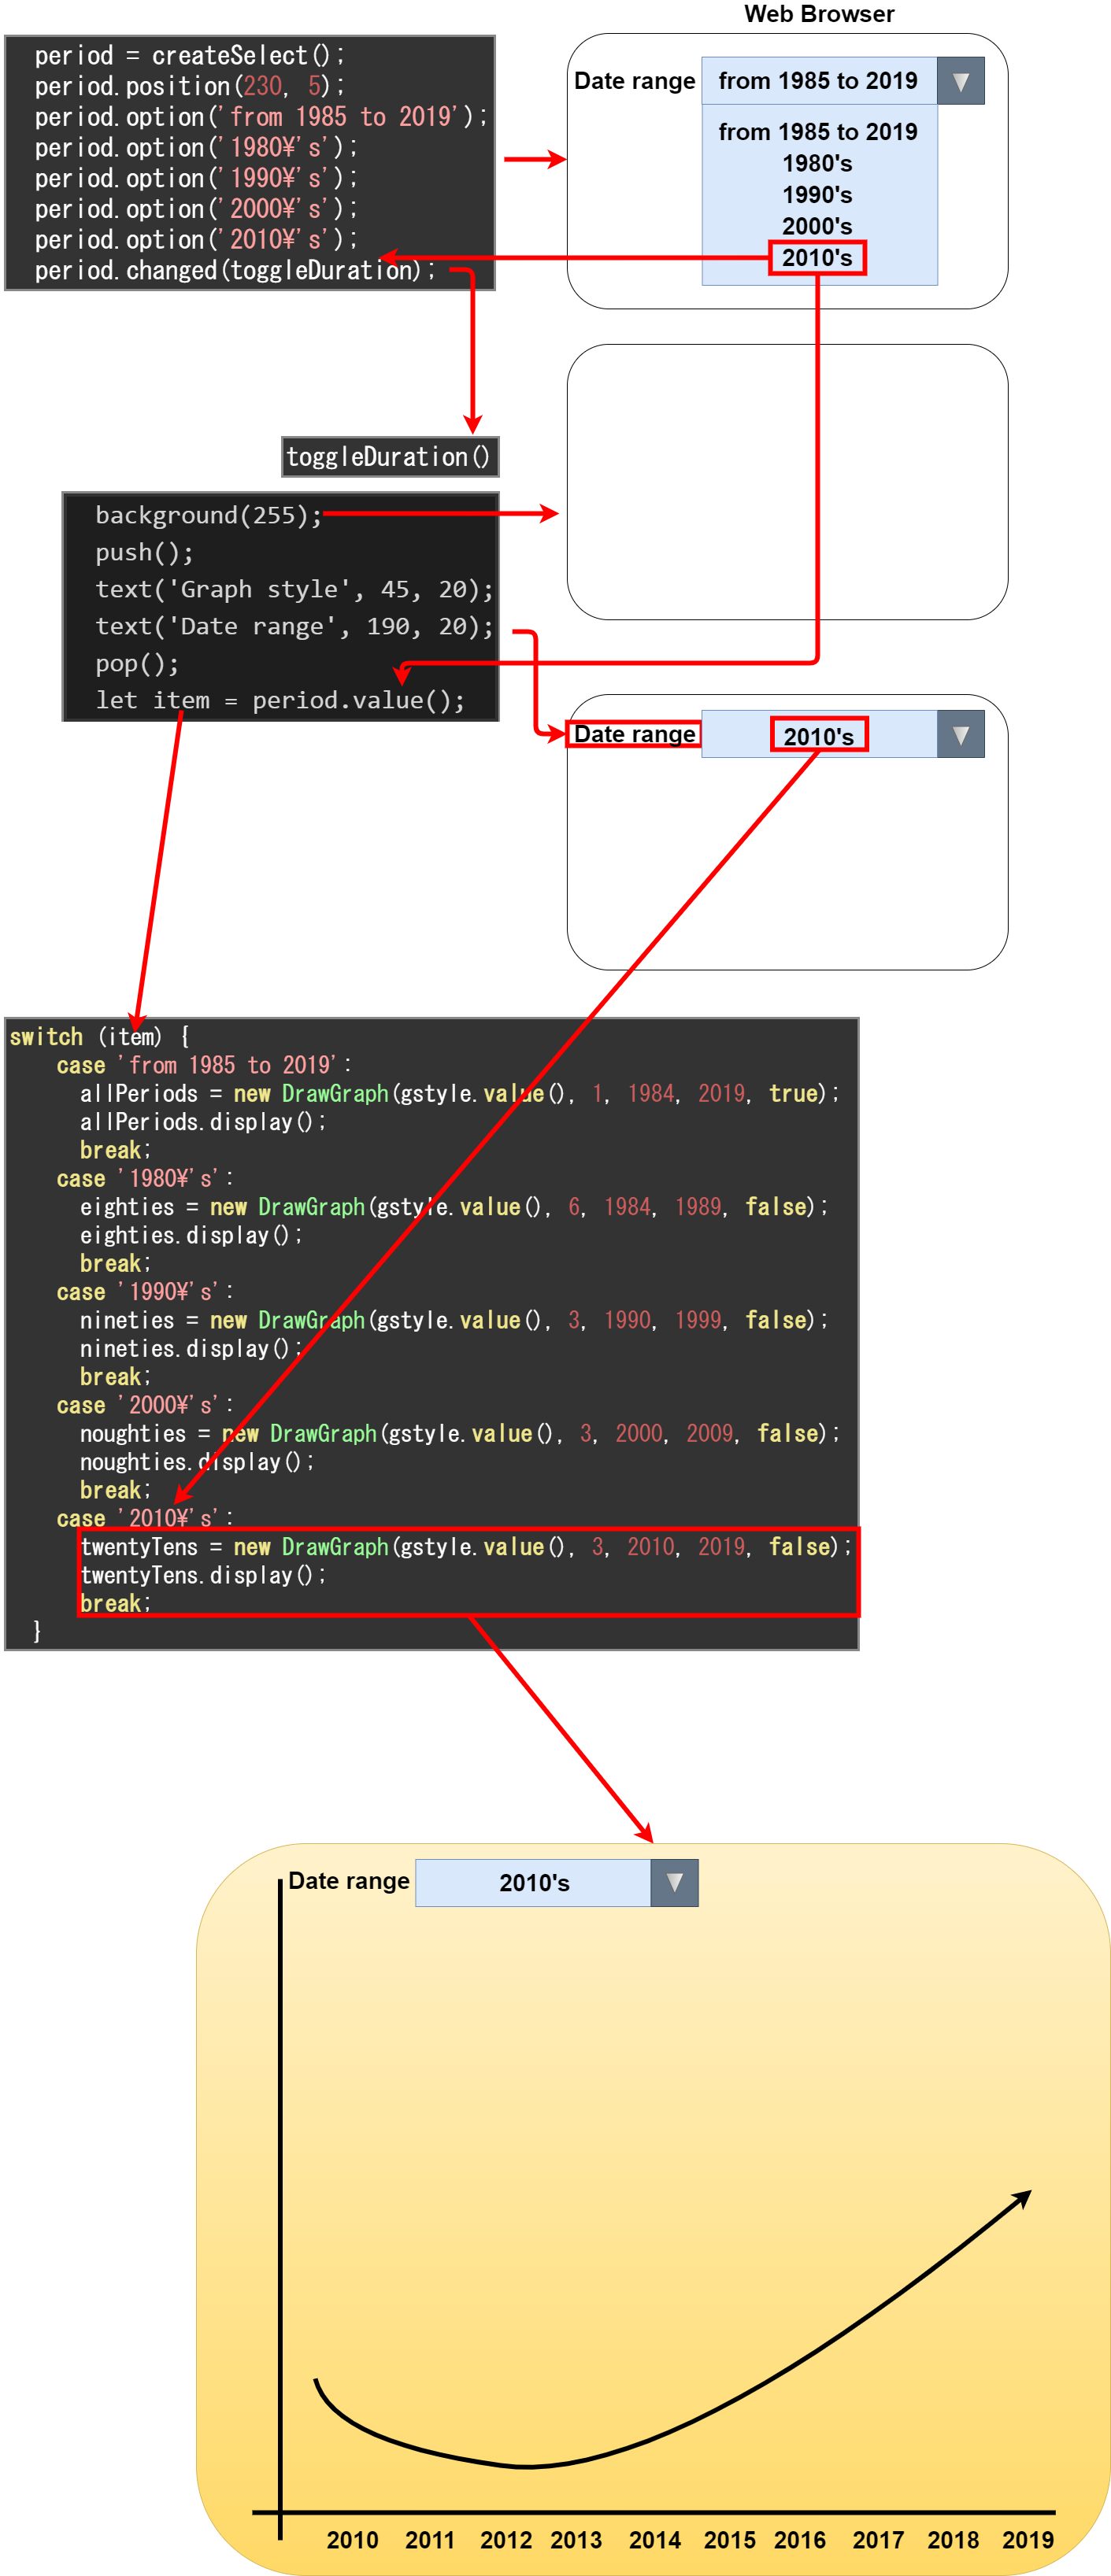
let item = period.value();
この関数は株価の推移の期間を決めるので、一度画面が再描写されます。 background(255)でキャンバスを白に塗りつぶし、再度テキストを表示させます。 そして、Selectタグで選択されたOption値を取得します。
This function determines the stock period and redrawn the screen. Use background(255) to fill the canvas to white and display the text again. It then gets Option value selected by the Select tag.
    switch (item) {
      case 'from 1985 to 2019':
        allPeriods = new DrawGraph(gstyle.value(), 1, 1984, 2019, true);
        allPeriods.display();
        break;
      case '1980\'s':
        eighties = new DrawGraph(gstyle.value(), 6, 1984, 1989, false);
        eighties.display();
        break;
      case '1990\'s':
        nineties = new DrawGraph(gstyle.value(), 3, 1990, 1999, false);
        nineties.display();
        break;
      case '2000\'s':
        noughties = new DrawGraph(gstyle.value(), 3, 2000, 2009, false);
        noughties.display();
        break;
      case '2010\'s':
        twentyTens = new DrawGraph(gstyle.value(), 3, 2010, 2019, false);
        twentyTens.display();
        break;
    }
  }
Switch文は()の中に判定する値を入れて、Caseによって値毎の処理を分けていきます。
The switch statement places the value to be judged in () and uses "case" to process each value.
function setup() {

-----------------------------------------------------------

  // Default Draw
  defaultDraw = new DrawGraph('normal', 1, 1984, 2019, true);
  defaultDraw.display();
}

function toggleDuration() {

-----------------------------------------------------------

    twentyTens = new DrawGraph(gstyle.value(), 3, 2010, 2019, false);
    twentyTens.display();
-----------------------------------------------------------
}
このnew DrawGraph()は次のセクションで説明します。
This "new DrawGraph()" is described in the next section
drawGraph.jsの説明
Description of drawGraph.js
お次はdrawGraph.jsの簡単な説明です。
Next, I'll show you brief description of the drawGraph.js.
class DrawGraph{
  constructor(graphStyle, scale, start, end, all){
      this.offset = (cwidth - offsetWidth) / 2;
      this.numArray = [];
      this.graphStyle = graphStyle;
      this.scale = scale;
      this.start = start;
      this.end = end;
      this.all = all;
      this.params = [];
  }
これはClassファイルと言って、簡単に説明すると、ある程度機能が似通った製品を作る工場のようなものです。
It's called a Class file, and to put it simply, it's like a factory where you can make products that are somewhat similar in functionality.
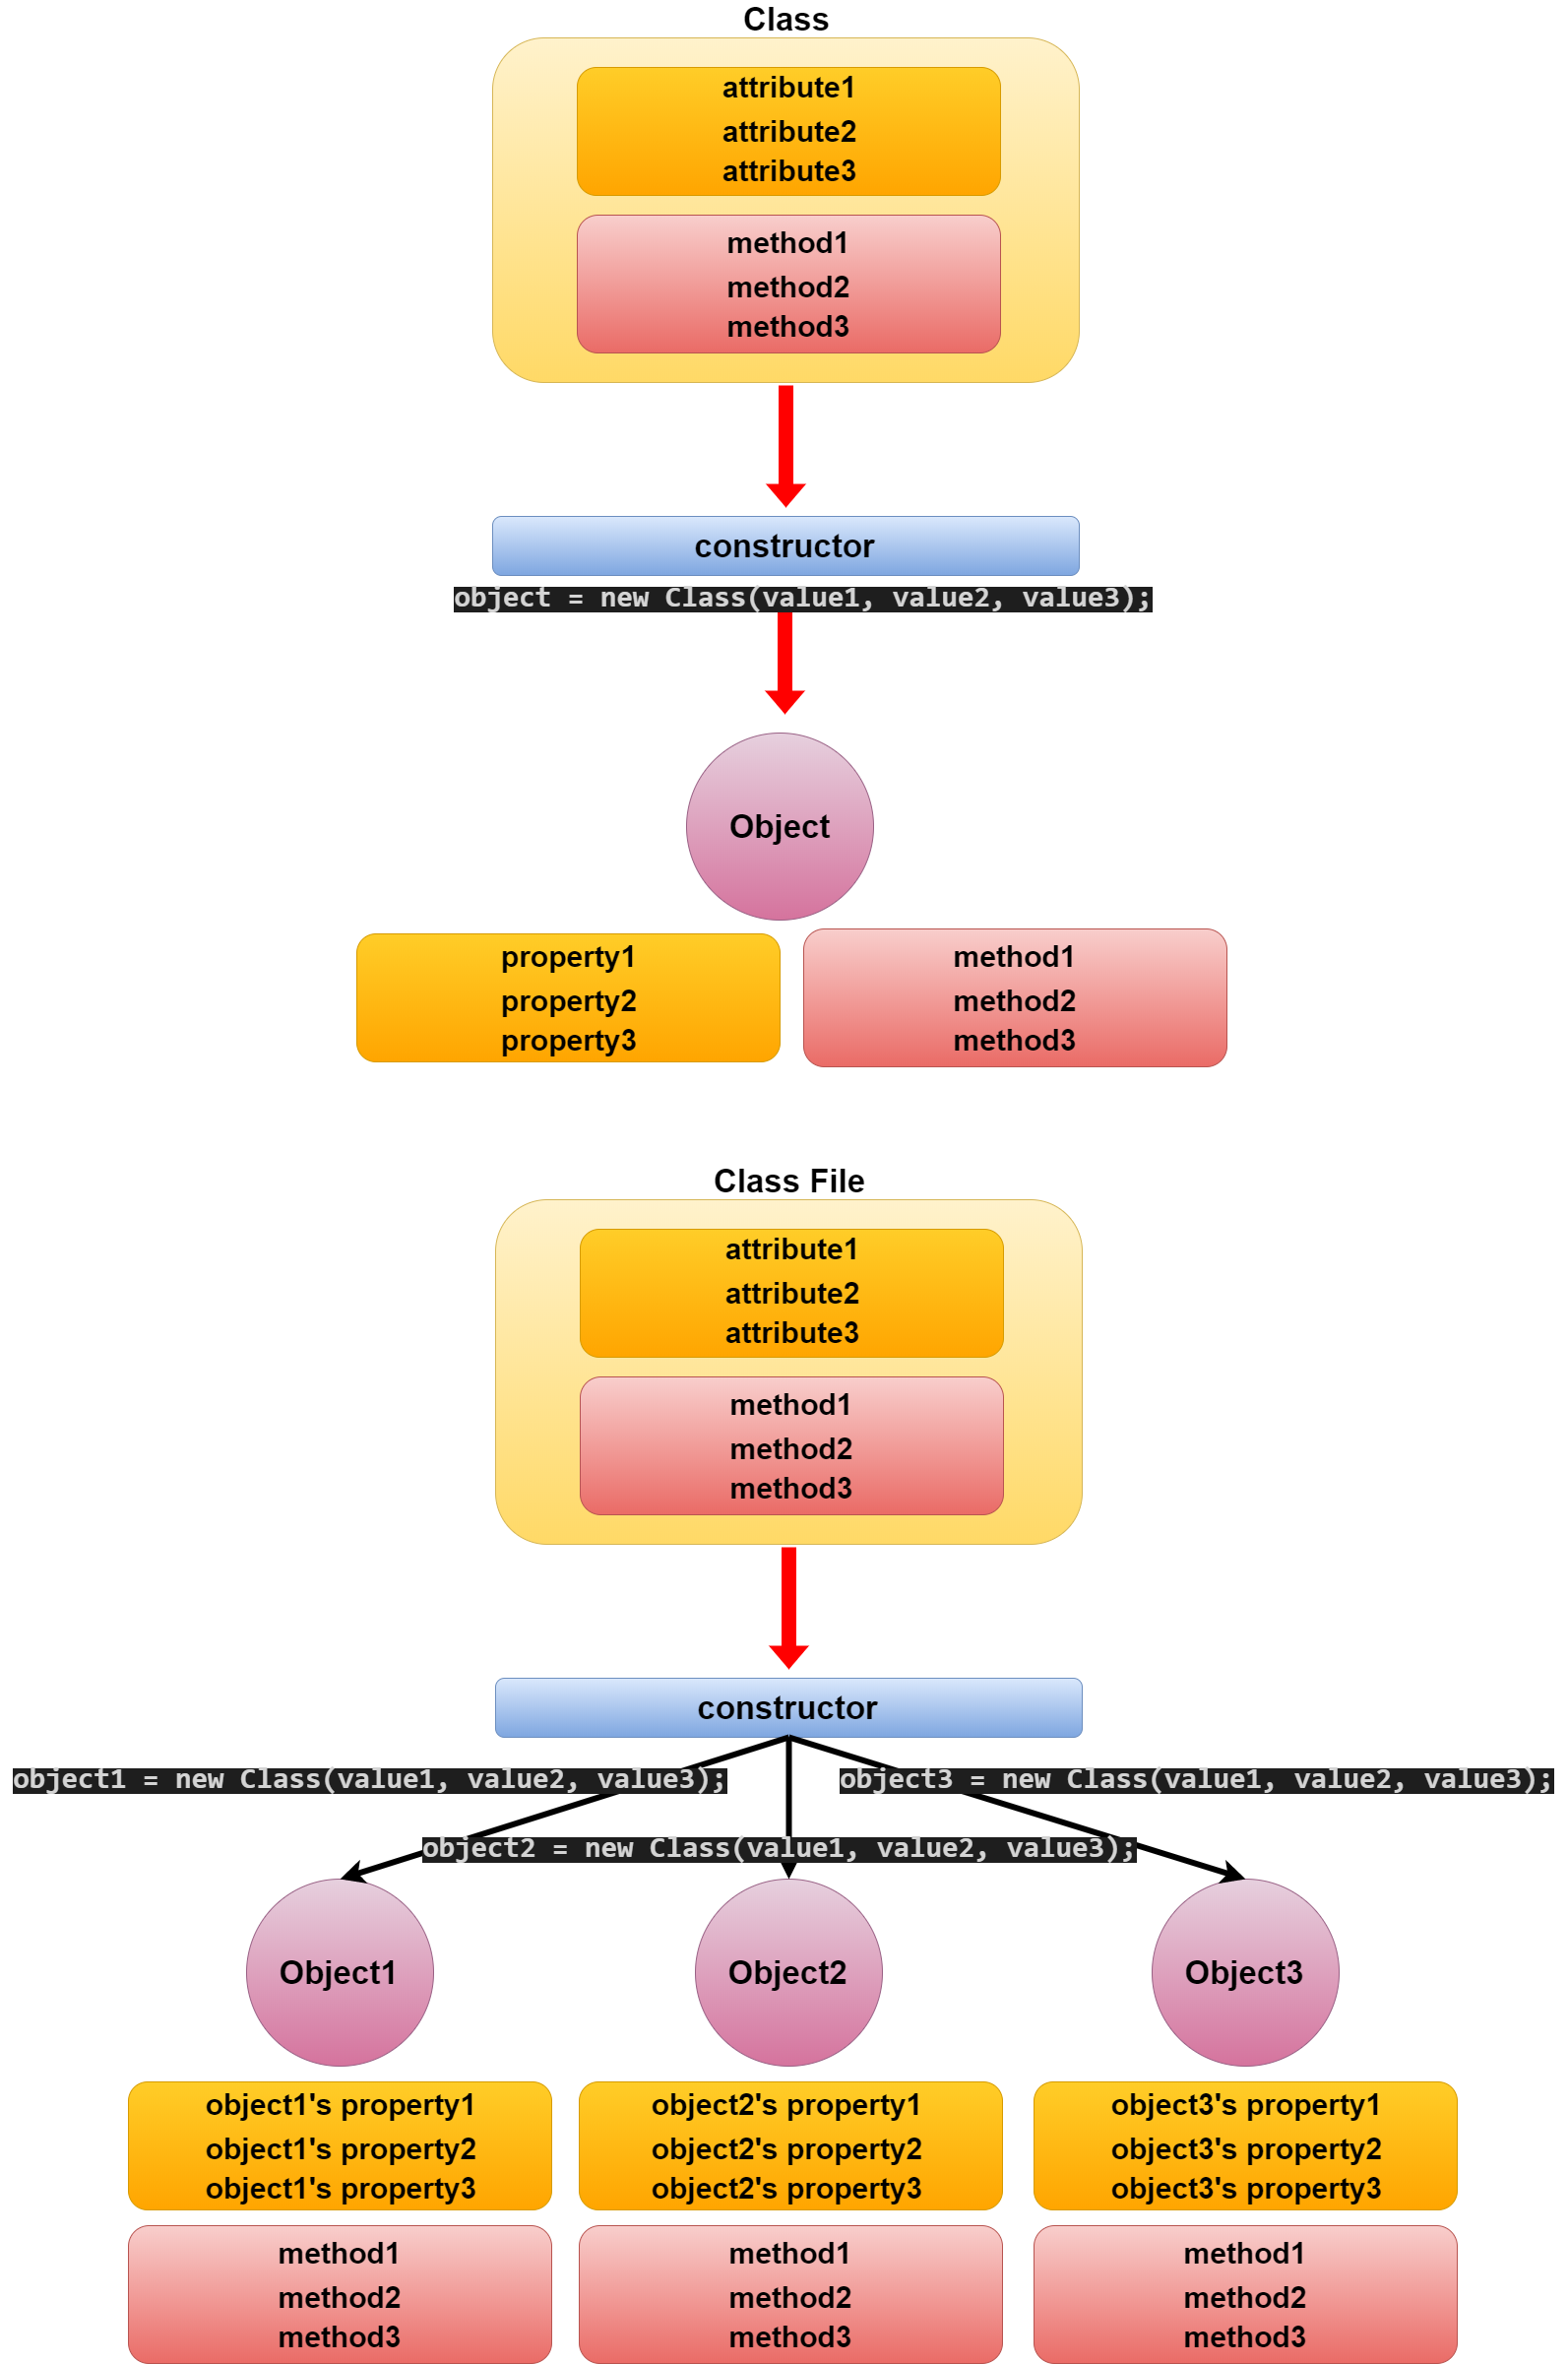
このようにClassファイルは予め製品の型を持っていて、後は値を入れて呼び出せば、 一つ一つ固有の同じ機能を持ったオブジェクトを幾つも作ってくれる。
In this way, the Class file has product type in advance and can be called with the value. It creates a number of unique objects with the same functionality.
p5.jsにおいて、この固有のオブジェクトを沢山作るという作業が大事になってくるのは、 例えば、マウスでクリックしたら色が変わる円を沢山作る場合です。 一つ一つの円が色を変えるというメソッドを持ち、さらに現在の色を保持するプロパティが必要です。
In p5.js, creating a lot of these unique objects is important if, for example, when you create many circles that change color when you click with the mouse. Each circle needs a method to change its color, and a property to hold the current color.
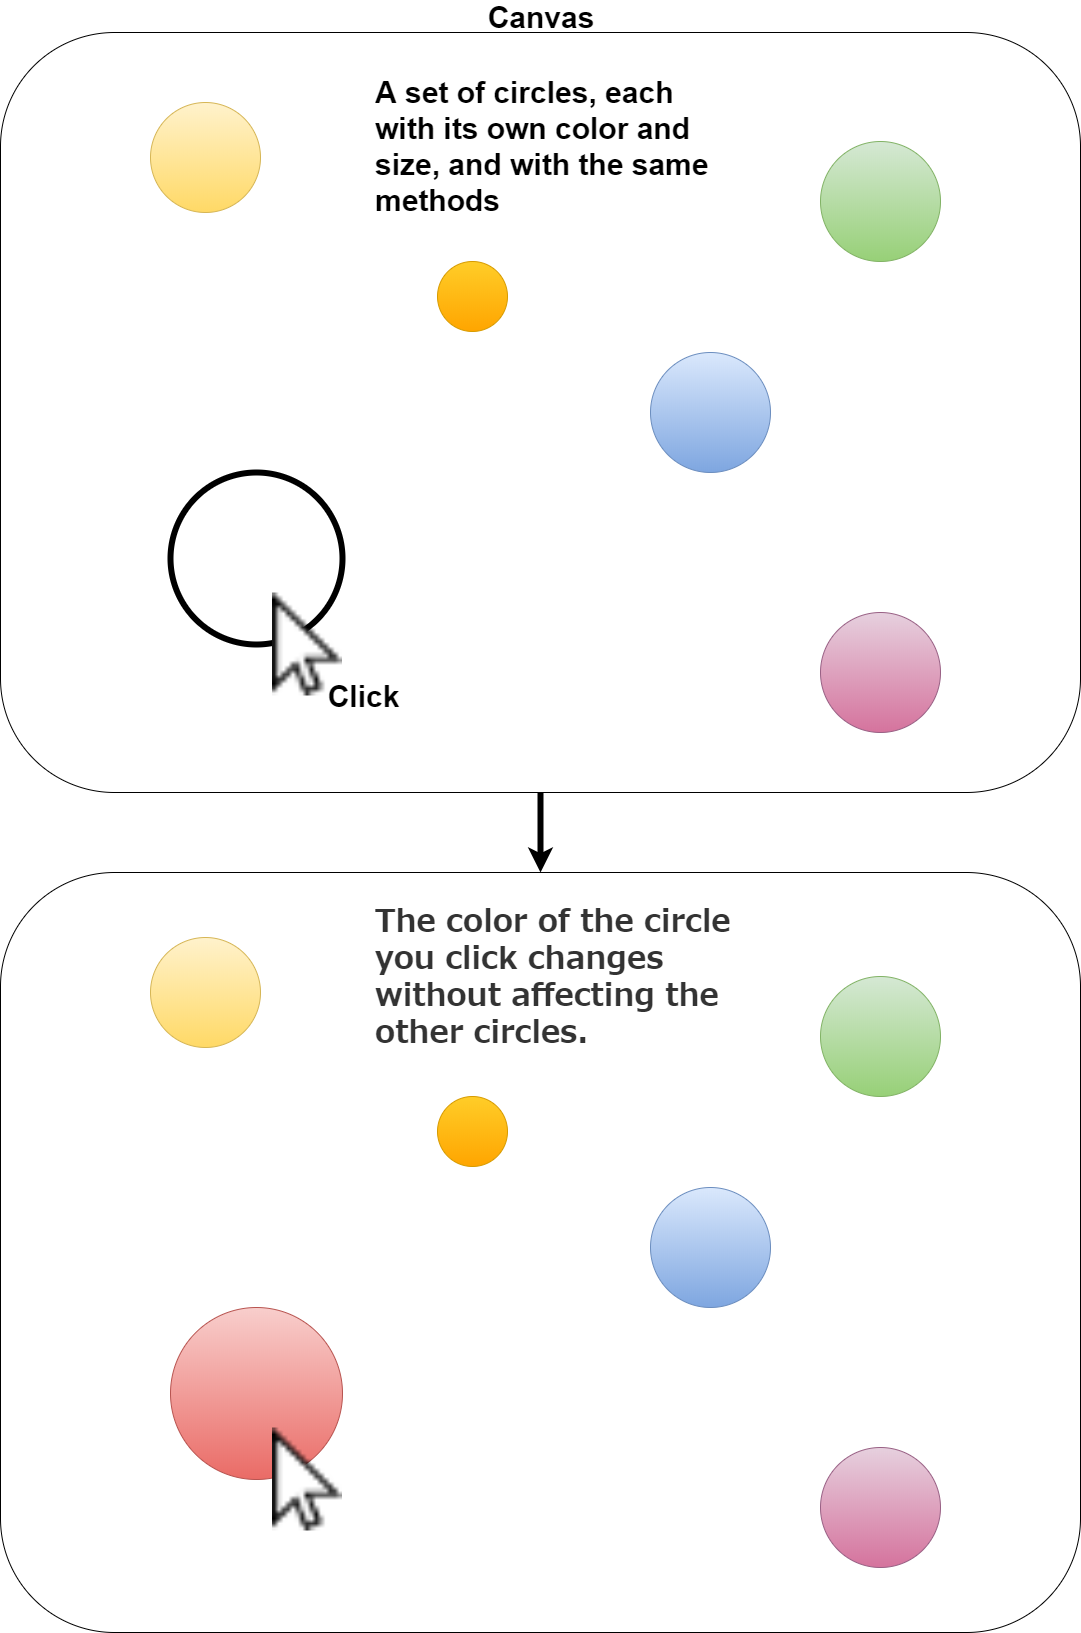
この沢山の円を今回のグラフを作るクラスファイルに置き換えて考えてみてください。 そうすればスクリプトの一行一行を理解しなくても、全体像が把握でき、すぐにオブジェクトを使ったコードが書けるようになります。
Try replacing these circles with the class file that creates this graph. That way, you can get the big picture without having to understand each line of the script and quickly write code that uses the object.
constructor(graphStyle, scale, start, end, all){
  this.offset = (cwidth - offsetWidth) / 2;
}
クラスの最初には必ずconstructorメソッドを挿入します。 こうすることで、このクラスはオブジェクトを作成してくれます。 引数を指定すれば、外部から好きなだけ値を決めることができます。 因みに「this」は「このクラスファイルによって作られた、オブジェクトそのもの」という意味です。 だから「this」なのです。
Be sure to insert the constructor method at the beginning of your class. The class then creates the object for you. You can specify any number of arguments to determine the value externally. By the way, "this" means "The object itself created by this class file". That's why it's called "this".
display(){
  ------------------------------------------------
}
そして、displayメソッドを使って実際にグラフを描画していきます。これは先程の円のオブジェクトでいう、色を変えるメソッドに相当します。
You then use display method to actually draw the graph. this is equivalent to the method for changing the color of the previous circle object.
後は単純に算数の計算をFor文とP5の図形関数を使って行っているだけです。
All that's left is a simple arithmetic calculation using the [For statement] and the P5 graphical functions.
あとはこのp5.js関数のレファレンスを見て幾つか組み合わせれば自分自身で沢山のスケッチを書けるようになりまうす。
Then, look at this p5.js reference and combine the functions in it, you will soon to make a lot of sketches yourself!
p5.js Web Editorへのアップロード
Uploading to the p5.js Web Editor
最後に簡単にスケッチを試したり、今回のように自分のブログにIframeとして貼り付けられるように、p5.js web editorにデータとコードをアップロードできるようにしましょう。
Finally, let's allow you to upload data and code to the p5.js web editor so that you can easily try out a sketch or paste it as an Iframe on your blog like my previous blog post.
p5.js web editorへのログイン方法、Iframeとファイルの作り方は[p5.jsでギタータブ譜作ろうぜ]こちらの記事を参考にしてくだちぃ。
Refer to this blog post [Let's make a guitar tab sheet with p5.js] for instructions on how to login to the p5.js web editor and how to create Iframe and files.
Web Editorへ今回のスクリプトを貼り付ける場合は、Classファイルも一緒のスケッチにすることをお勧めします。
If you paste this script into the Web Editor, it is recommended that the Class file also be a sketch file.
ではCSVデータをアップロードする方法です。
Then, this is how to upload CSV data.
まずスクリプトを書いたら、スケッチをセーブします。
Write the script first, then save the sketch.
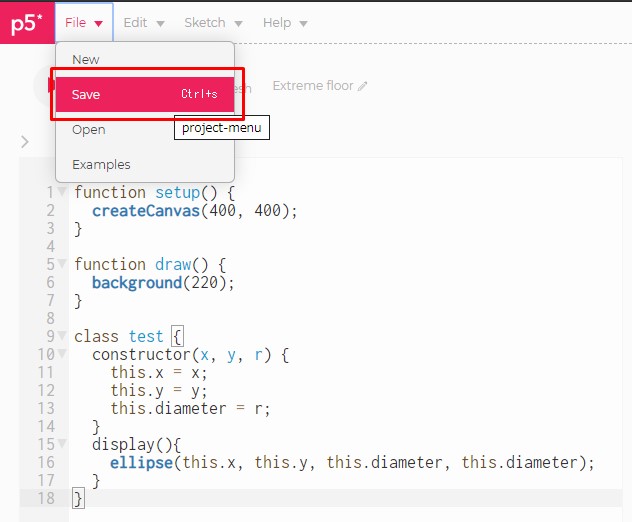
保存が終わったら、「Sketch」から「Add file」を選択して、アップロードするデータファイルを指定します。
After saving, select [Add file] from [Sketch] and specify the data file to upload.
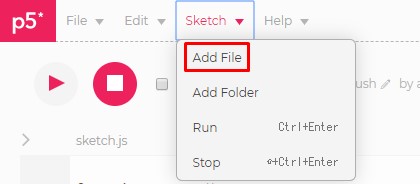
ファイルはドラッグアンドドロップで移動できます。
You can move files using drag and drop.
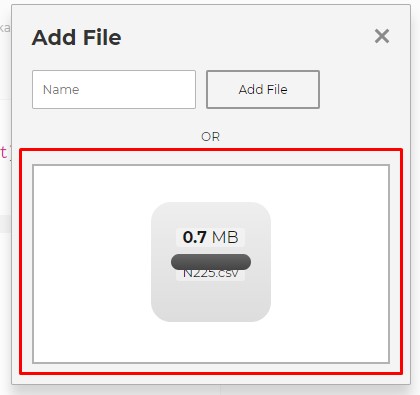
このようにしてファイルをアップロードできれば、Sketchファイルと同じ階層にファイルが置かれているので、 データを読み込む際には、単純にファイルの名前を指定するだけで読み込めます。
If you can upload the file this way, the file will be in the same hierarchy as the Sketch file. When you import data, you simply specify the name of the file.
table = loadTable('N225.csv', 'csv', 'header');
ということで終了DESU。
So, this is over.